Navigator v2.0
Experience Pipeliner CRM Now
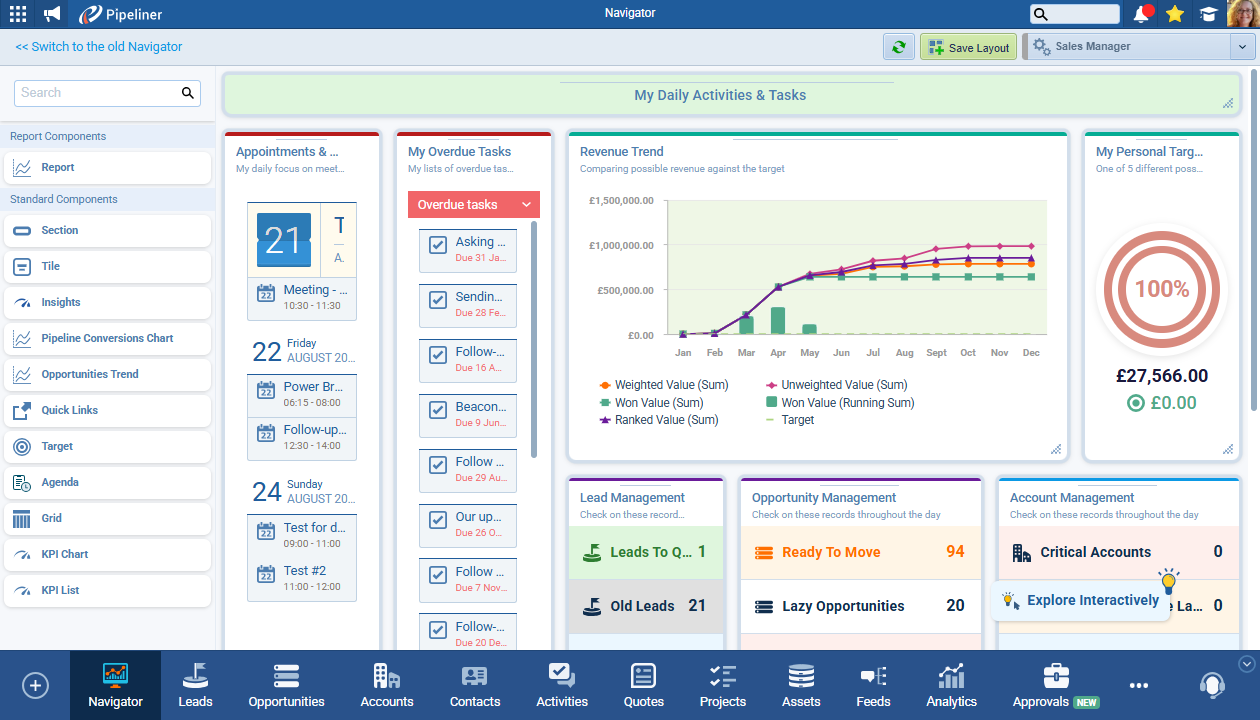
We’ve added 3 additional components to the new Navigator — Grid, KPI Chart, KPI List — and updated the chart types available in the existing Target component as well as adding an option to create Navigator layouts from Dashboard layouts (or vice versa) and then sync to keep the contentContent Content refers to a material or document released in various forms (such as text, image, audio, and video) and created to inform, engage or influence specific audiences. in alignment.
The Grid component
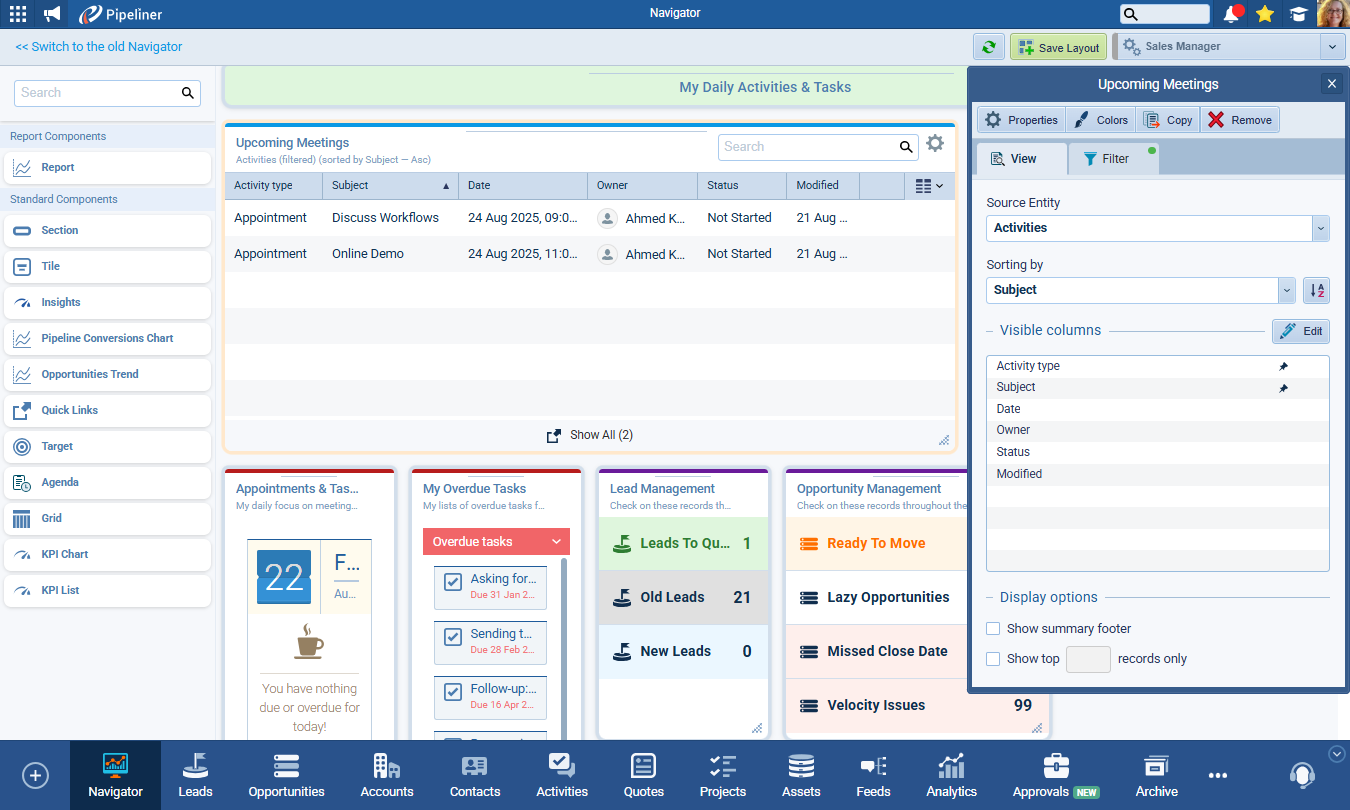
Users can drag a Grid onto a Navigator Layout and then Edit to access the View Tab to select:
- Source entity › all main system and custom entities are available
- Sorting by direction › sort by any field on the selected entity (users can also change the sort order by clicking a column in the grid)
- Visible columns › columns can be added and removed in the same way as in reports by clicking the Edit button or a column can also be added instantly to the grid exactly like working with List Views
- Display Options › the userUser User means a person who uses or consumes a product or a service, usually a digital device or an online service. can choose to Show summary (like in reports) and, if there are lots of records, to Show top X records only (it will show the first X records based on the filtering and sorting settings)
The Filter tab allows the user to filter the records to be displayed in the grid.
In the Grid itself, there is a Search bar and a Show All link which opens a drill-down with all the grid’s records.
The KPI chart component
The KPI chart component summarizes the selected KPI values from the specific period and compares the results with the different/previous period. It also displays a small chart that indicates progress/changes during the period (running sum/sum).
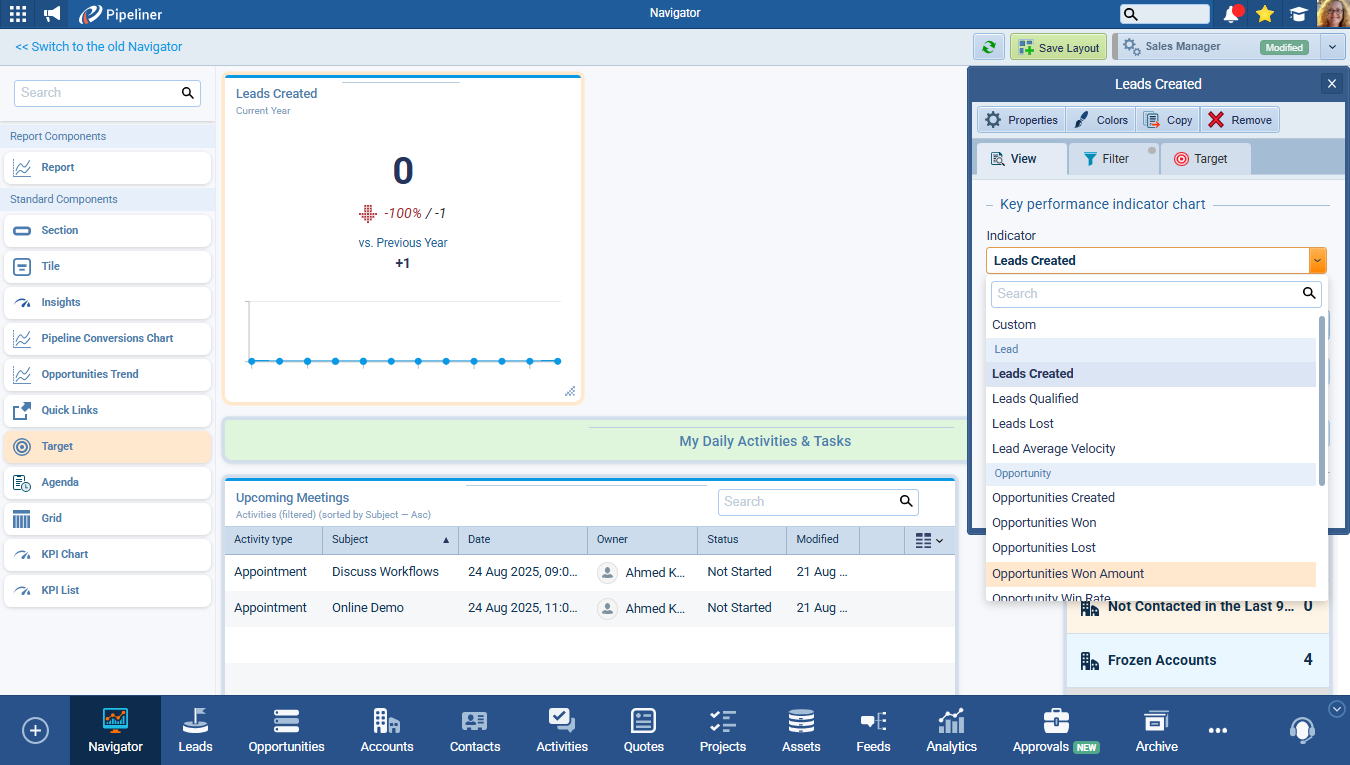
Users can drag a KPI Chart onto a Navigator Layout and then Edit to access the View Tab to select:
- Indicator › this is a list of all our predefined indicators from Insights › Indicator plus a Custom option which gives dataData Data is a set of quantitative and qualitative facts that can be used as reference or inputs for computations, analyses, descriptions, predictions, reasoning and planning. aggregation of the field selected from the entity chosen in Source Entity
- Period › the user can define the “target” period — all KPI data for summarization will be used from the selected period
- Comparison › the user can choose a different period for comparison of the selected KPI
- Target › for the chart only — visible target line; target can be set in the Target tab
NOTE: The chart will show the line as a Running Sum for indicators like Create, qualified, and amount. For indicators like average opportunity size, the line is shown as Sum per group.
Filter tab options vary depending on whether the user is using a Custom KPI which allows access to the usual filter for the selected Source entity or, if using a standard KPI indicator, it’s the KPI filter as we are using in Insights › Indicators › Filter › Custom.
Target — it’s the standard target setting as for other components.
KPI list component
Users can drag a KPI Chart onto a Navigator Layout and then Edit to access the View Tab to select options to add to a list of KPIs by clicking on the Add button. The display includes:
- Indicator Name
- Period range
- Current Value › sum of values from selected period
- Previous value › sum of values from a previous period as a comparison
- Relative difference › relative deduction = (current values sum – sum of values from previous period up to the same day in that period)
- Difference – absolute deduction = (current values sum – previous values sum)
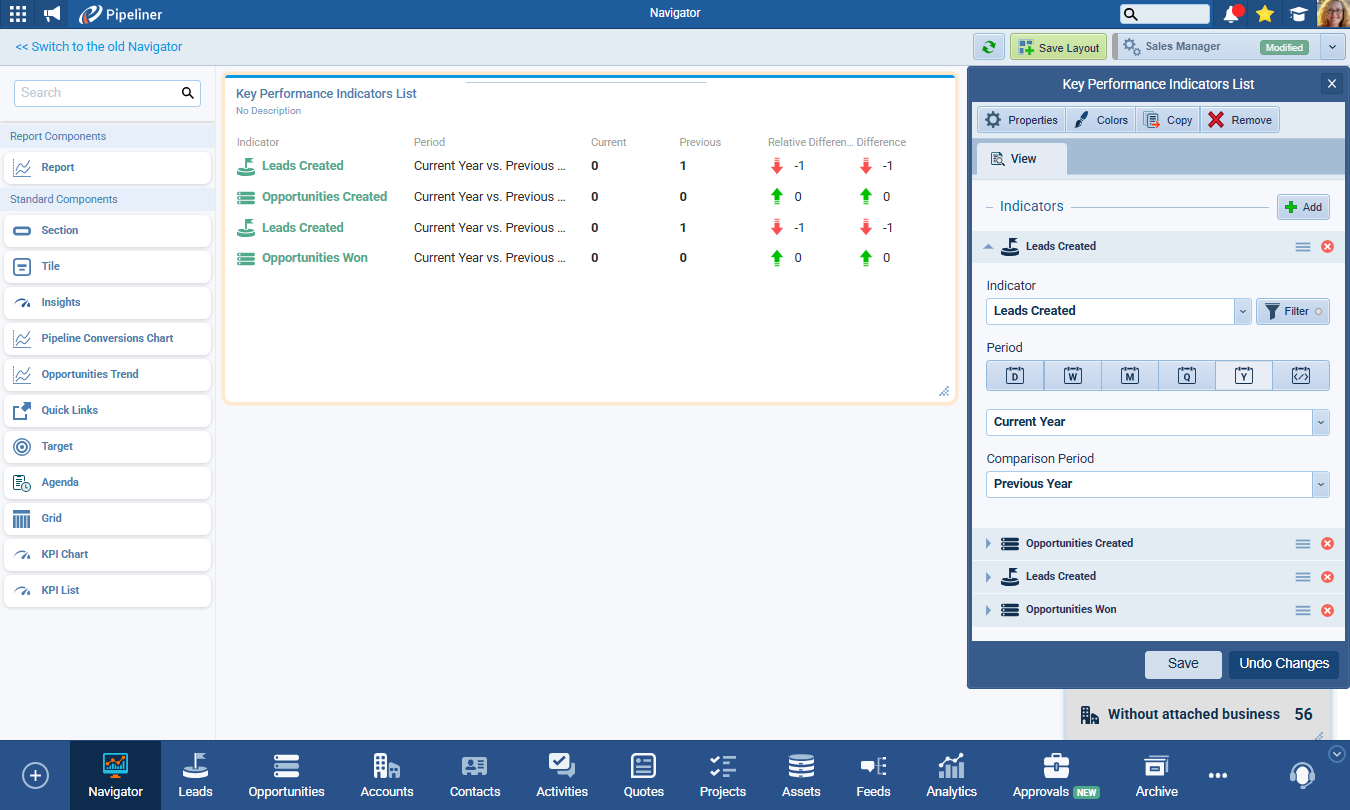
From the View Tab, in the List of KPIs, each item can have:
- the same setting as the KPI chart component, with an included Filter
- a different color setting
- a different name
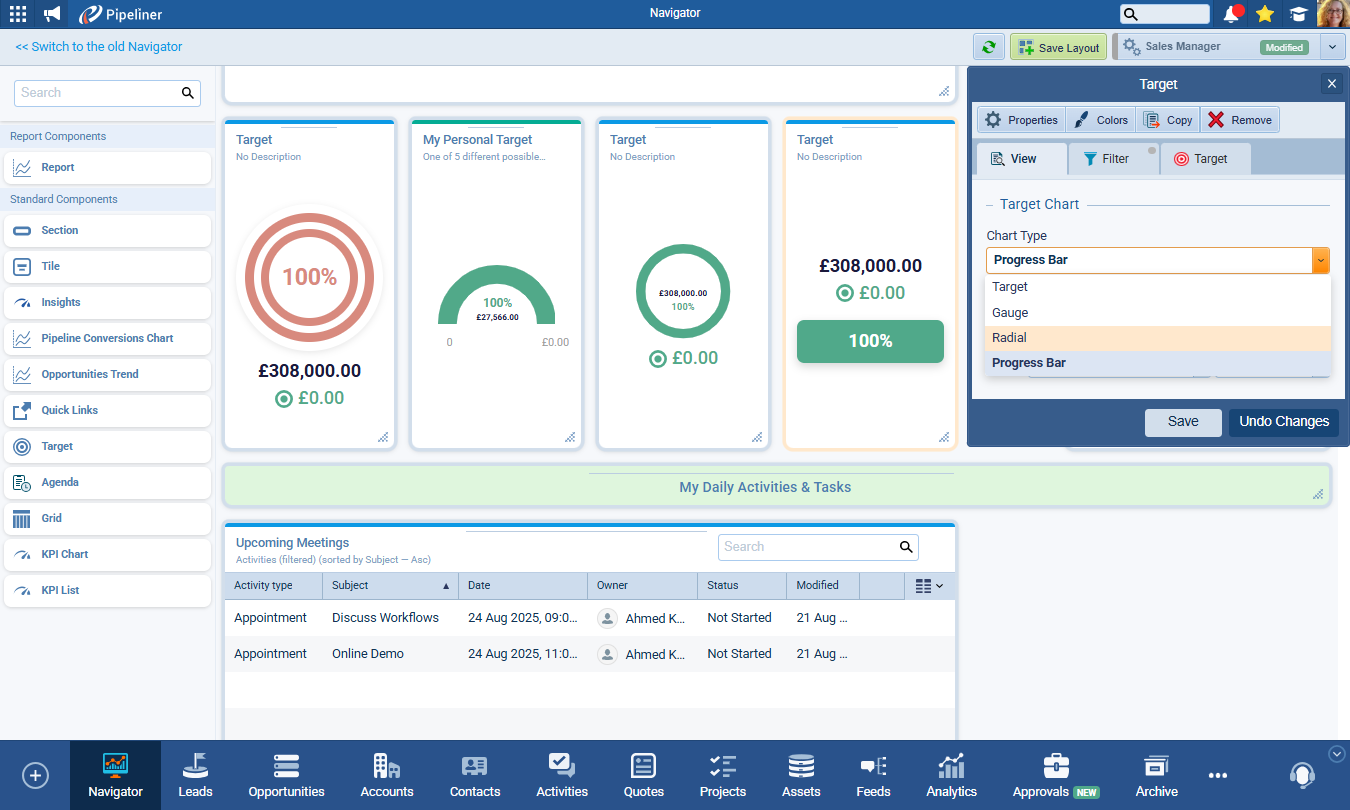
In the Target component, users can now select from additional Chart Type options: Gauge, Radial and Progress Bar.
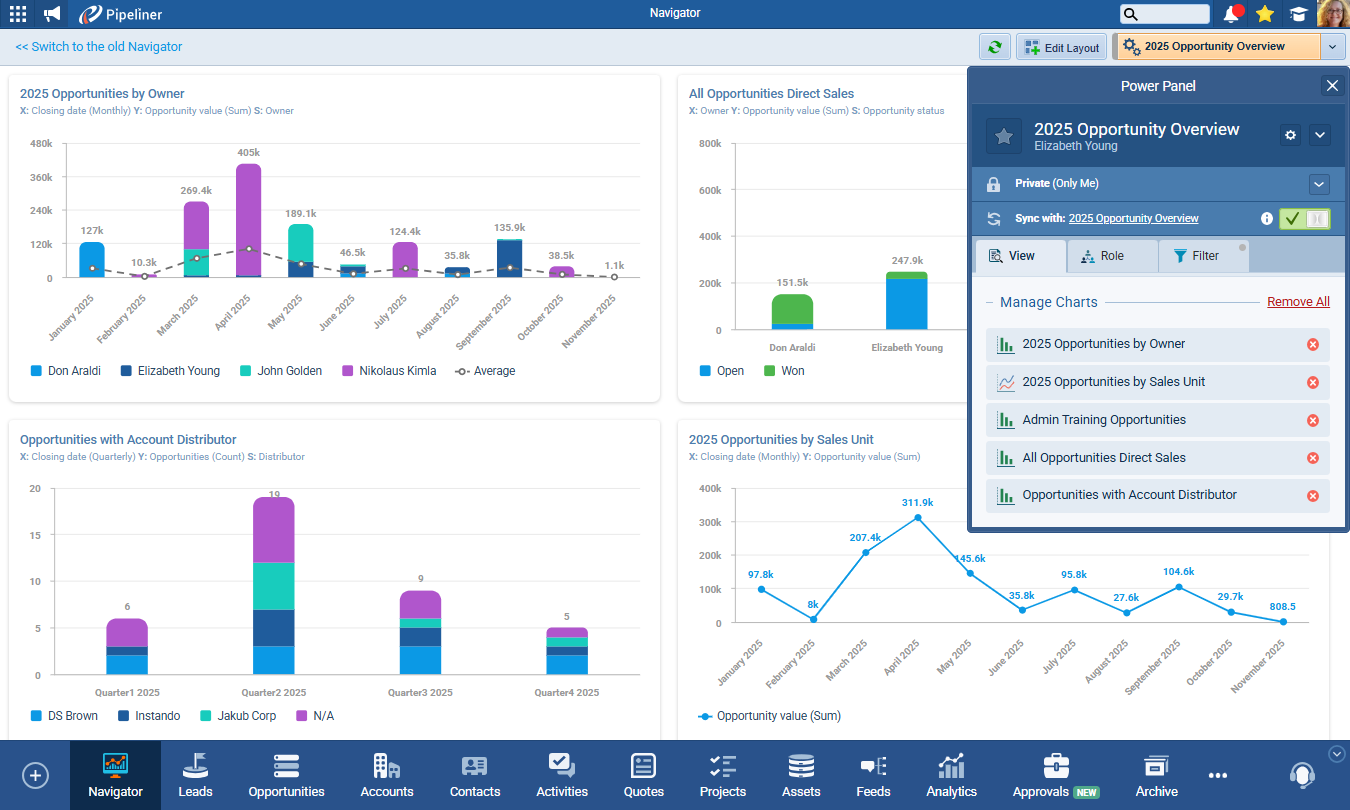
Import Dashboard as a Navigator (& vice versa)
Users can import a dashboard as a new navigator layout or the navigator as a dashboard.
From Navigator
The user can select to create a “New profile from Dashboard” when creating a new Navigator profile.
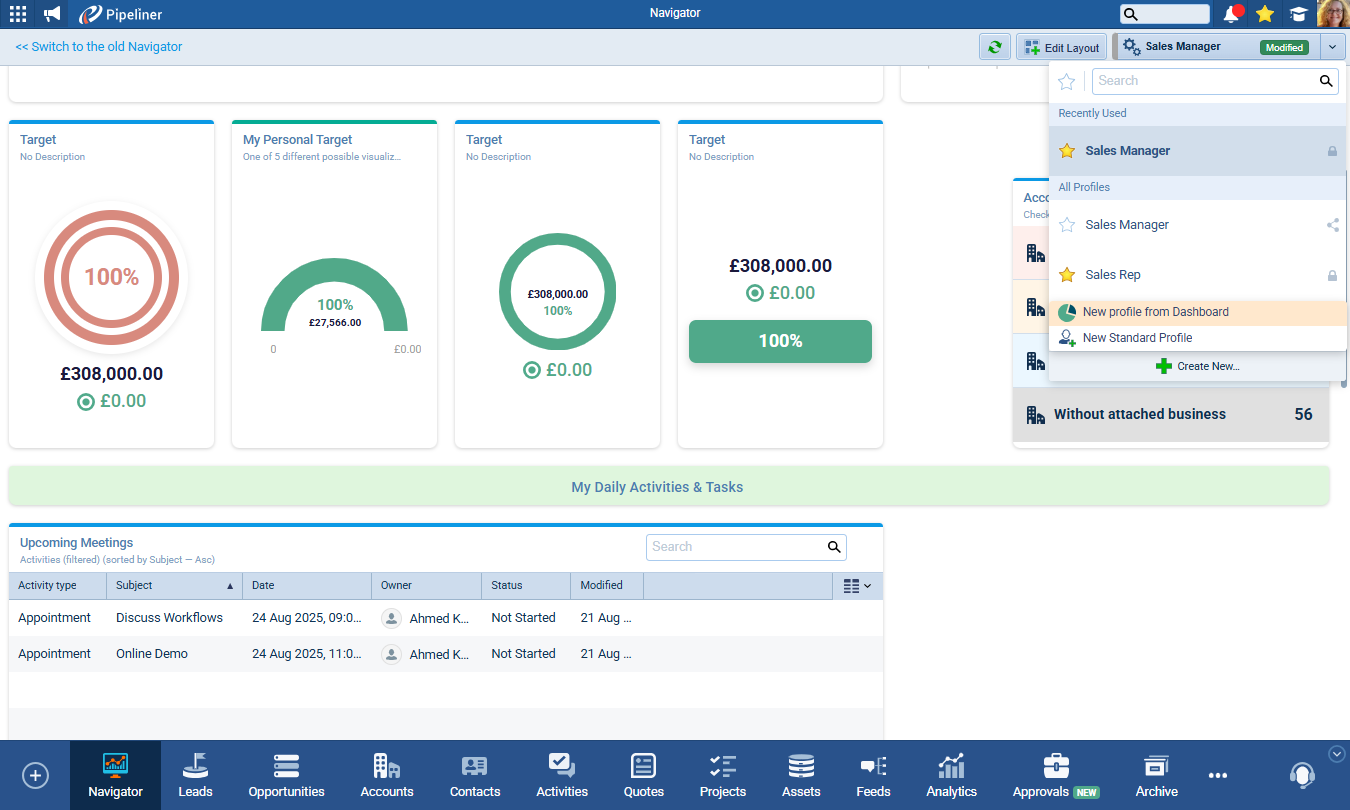
They will then be able to choose from Visible Dashboards where
- (The user is the owner
- OR where user is an editor)
- AND all where sync is OFF
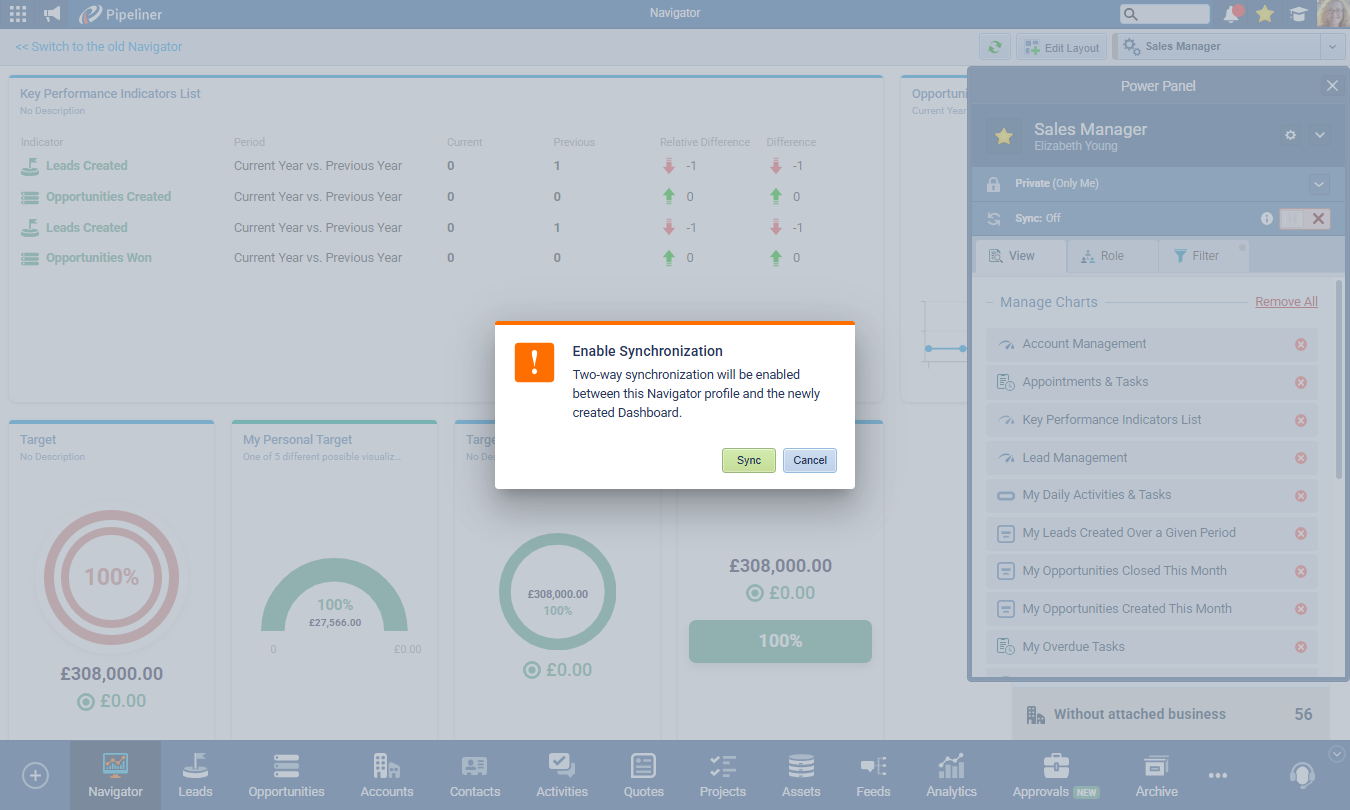
Selecting a Dashboard will enable bi-directional sync between the new Navigator profile and the original Dashboard. Sync can be turned off at any time. If sync is then turned on again, it will replace the data on the “other side”, and the user must confirm this action.
From Dashboard
Users can choose to create a “Dashboard from Navigator”.
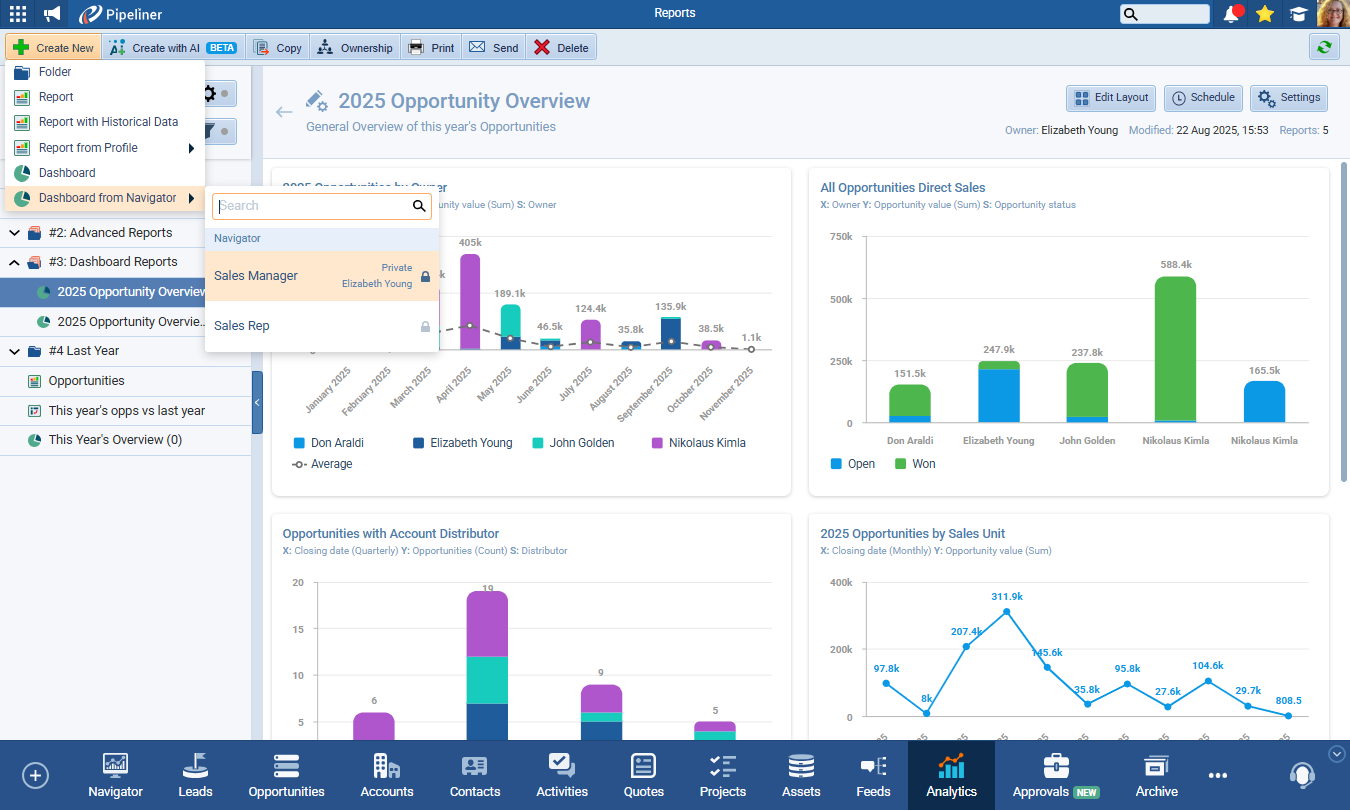
When using this option, the user can select from any Navigator profile that they are the owner of and where sync is OFF. Selecting a Navigator profile for the new dashboard will enable the bi-directional sync between these two entities.
IMPORTANT: Sync can be turned ON on any navigator or dashboard without the need to be added from one side or another — this action will automatically create a new navigator profile or dashboard. (A Dashboard created this way will be found in the root folder).
The user will see a message about sync being enabled and then a second confirmation when clicking the “Sync” button.
Fullsize Screenshots ⤵
Tags in Activities
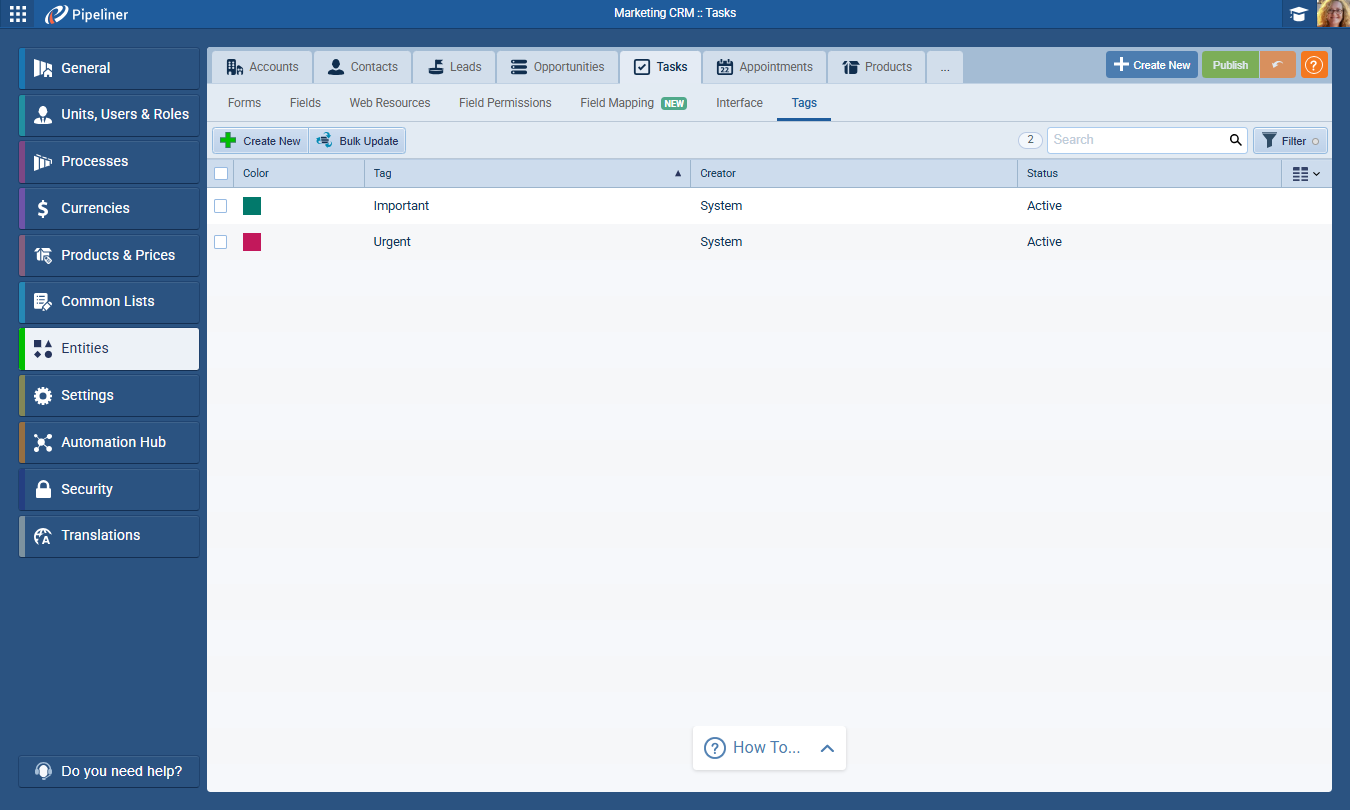
In response to customerCustomer Customer is an individual or an organization that purchases a product or signs up for a service offered by a business. feedback, we are implementing Tags for Activities. Users can now create separate Tags for both Tasks and Appointments and these tags will work the same as everywhere else in Pipeliner. In the Calendar View tags will be displayed as badges.
Admins can create and manage tags for Tasks and Appointments separately using the Tags subtab in Admin › Entities › Tasks/Appointments. Different tags can be created for different Activity Types.
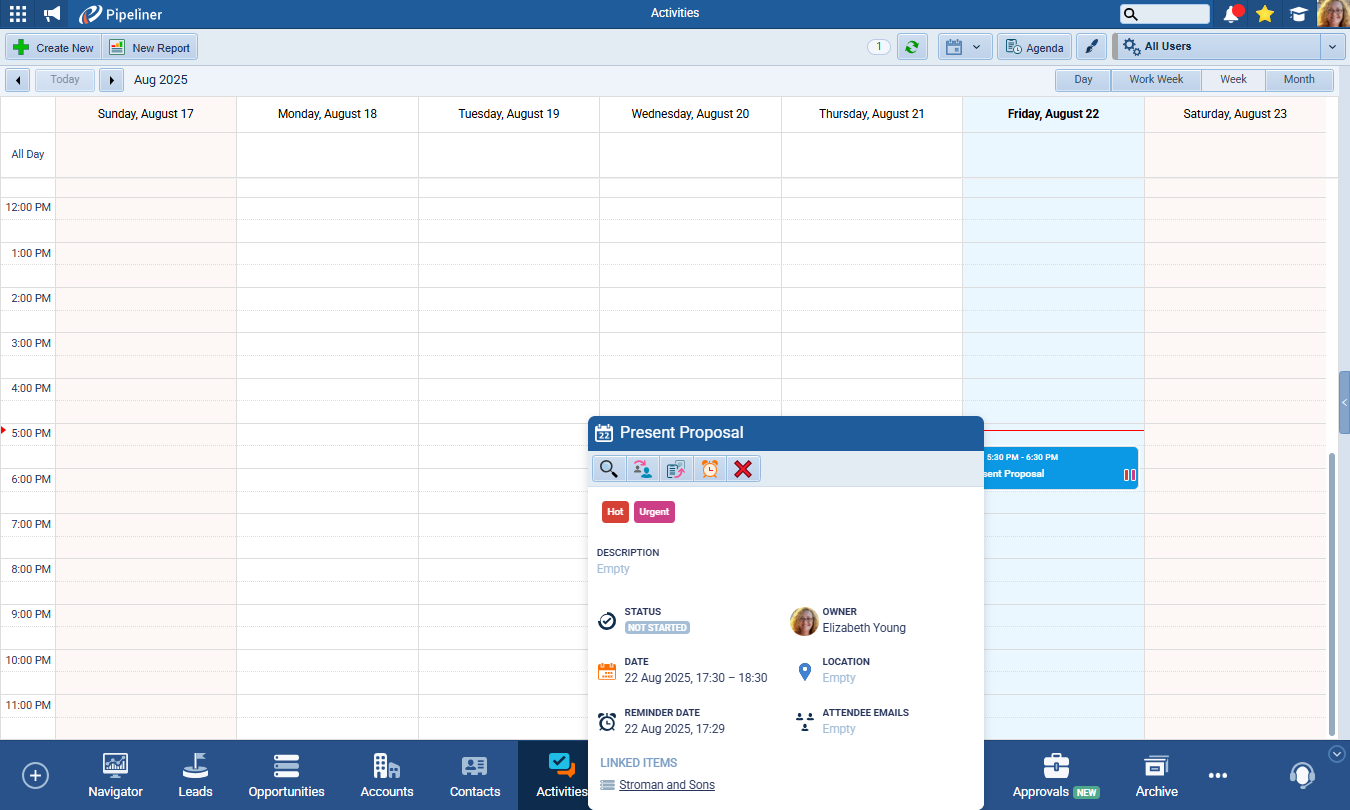
Calendar view
Tags in calendar view are displayed as badges.
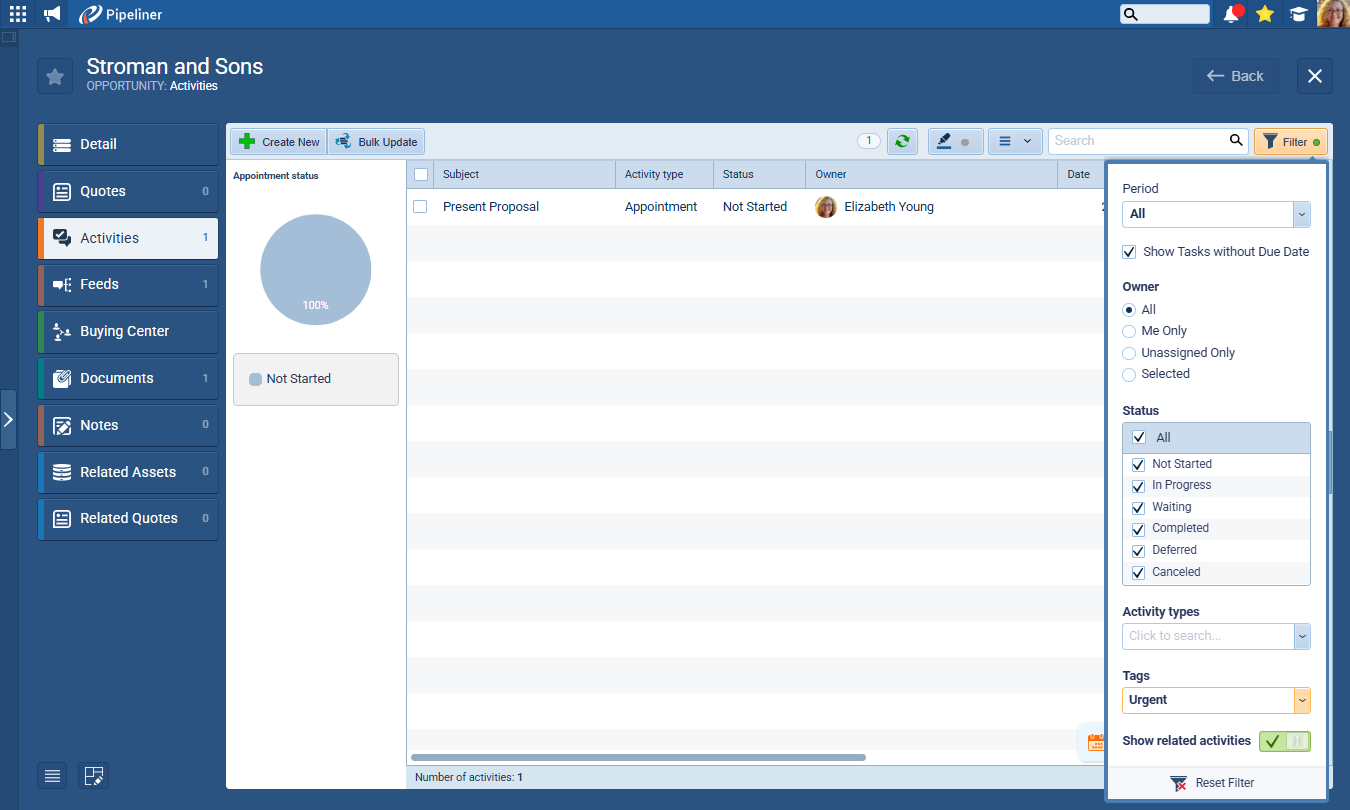
Related Activities Filter
Users can now also filter related activities on other entities by tags.
Fullsize Screenshots ⤵
Conditional Coloring of Activities
We have received a lot of feedback from our customers regarding recent changes to the Calendar and coloring. What we’ve found is that customers all have different preferences for how calendar coloring should work so we’ve changed it to allow users to choose what conditions to base both background and border colors on.
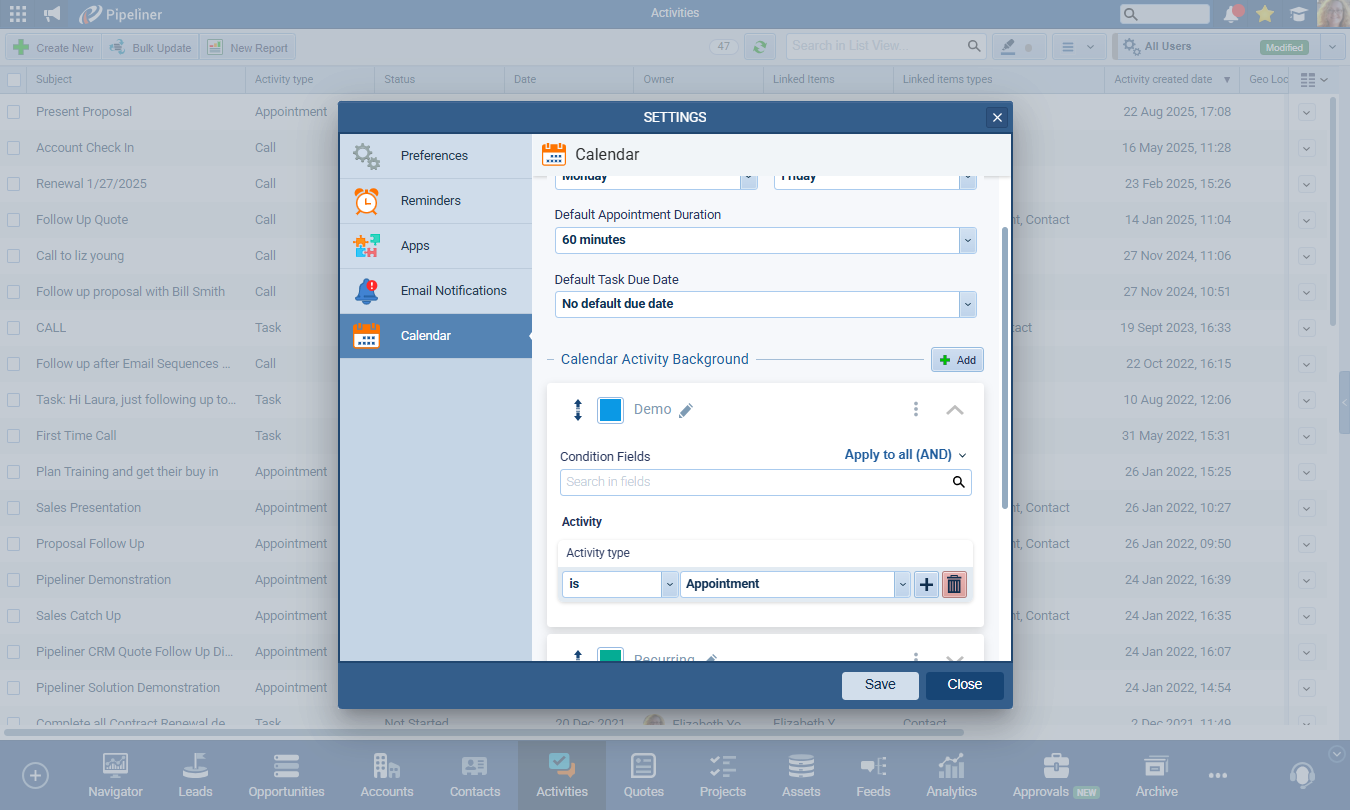
Calendar Activity Background (changes)
Previously, the background color was locked to the Owner of the activity with users able to select other users and assign them a color to see who owned which activity. We’ve replaced the user selector with a rule creator, so users can now set up any rules for activity background coloring. Note that the position of the rules matters — the first rule that is met determines the color applied as the background to the activity.
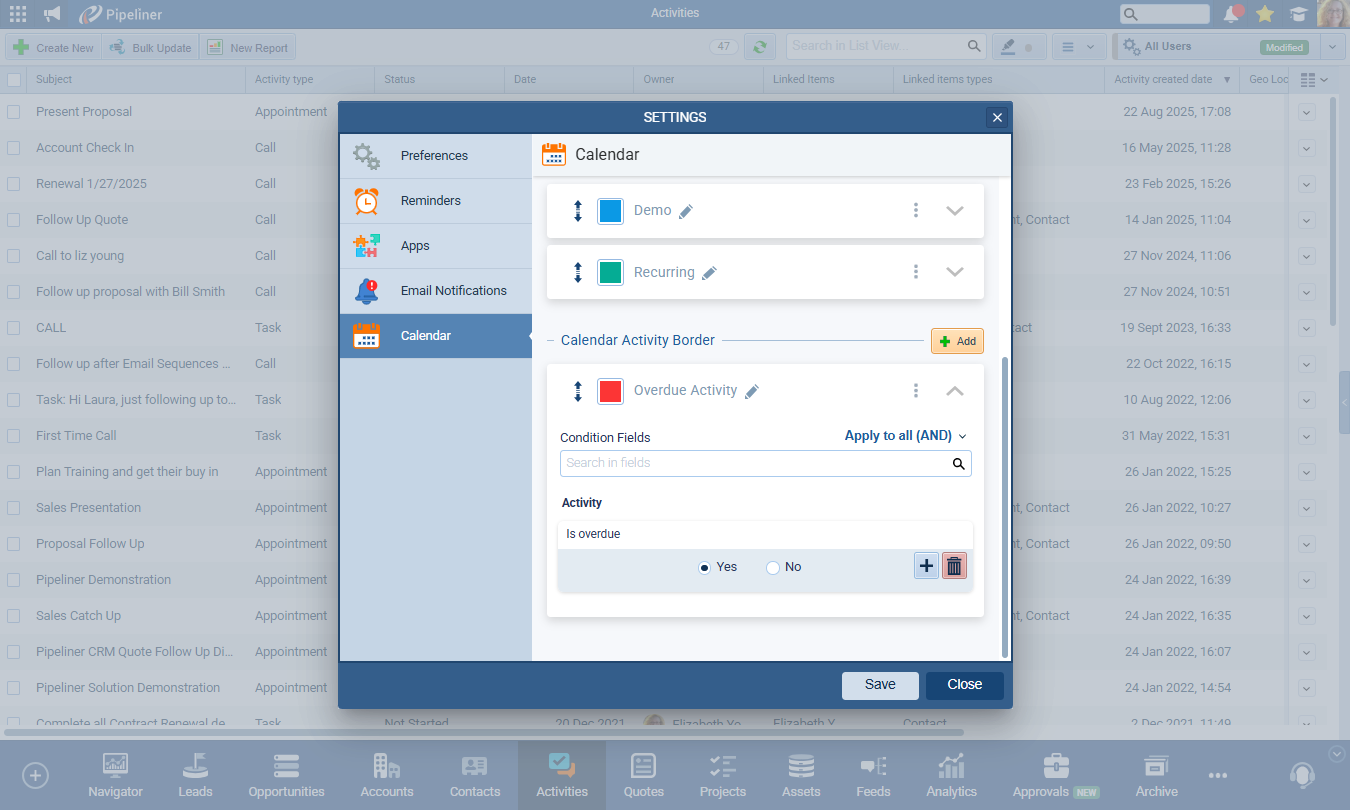
Calendar Activity Border
Previously, this area was named Calendar Activity Badge but as we’re implementing Activity Tags that are replacing badges, we have decided to change what is being colored by rules. From now on, this setting determines the color of the activity border and does not create any badges.
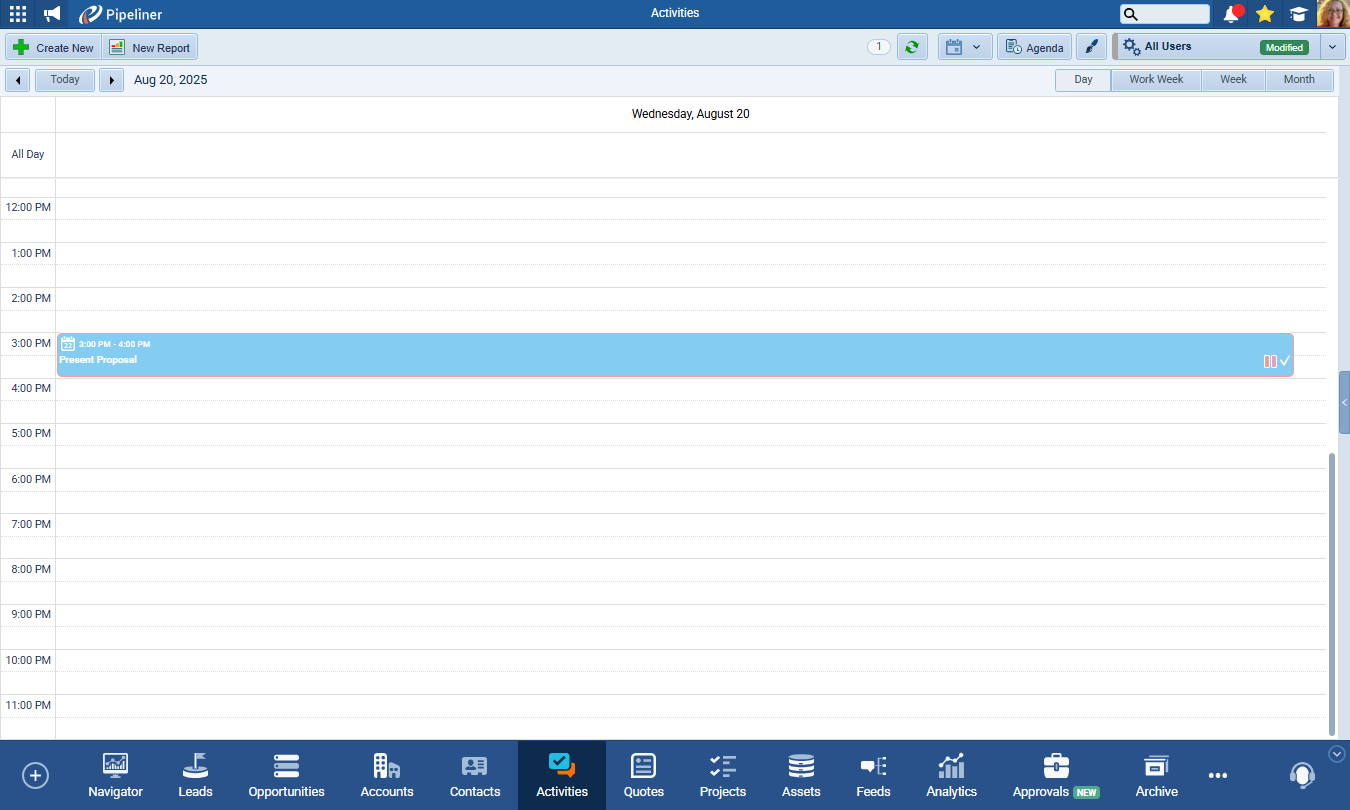
Calendar View of background and border
If conditions are met for rules set under “Calendar Activity Border”, the activity border will be colored in the Calendar view.
Fullsize Screenshots ⤵
Users’ Support in Lookup Field
Admins can now create Lookup fields based on Users and can apply Filter criteria to limit the users who can be selected when the field is used in the app.
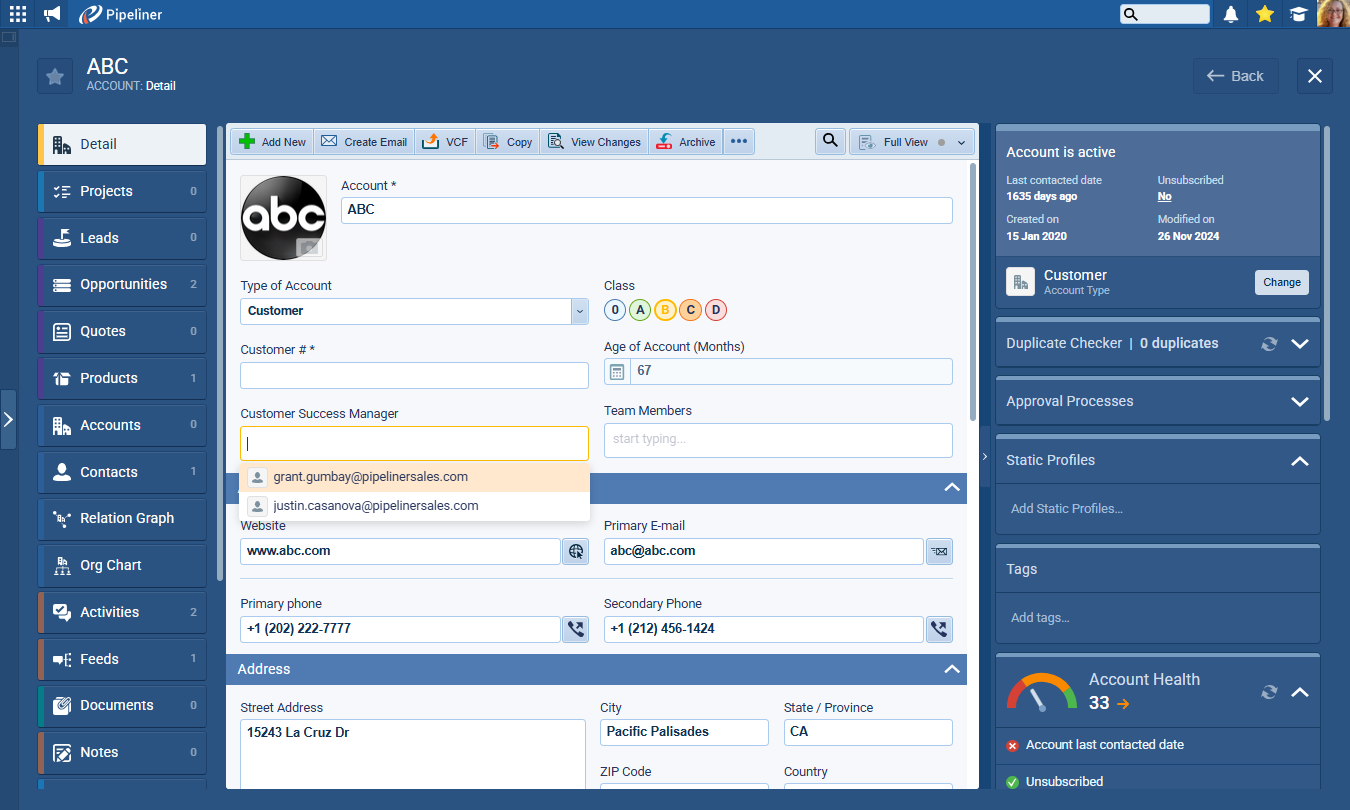
From the Admin Module › Entities, select the entity and create a new Lookup field choosing User as the entity. Click on the Filter option to add the filter criteria.
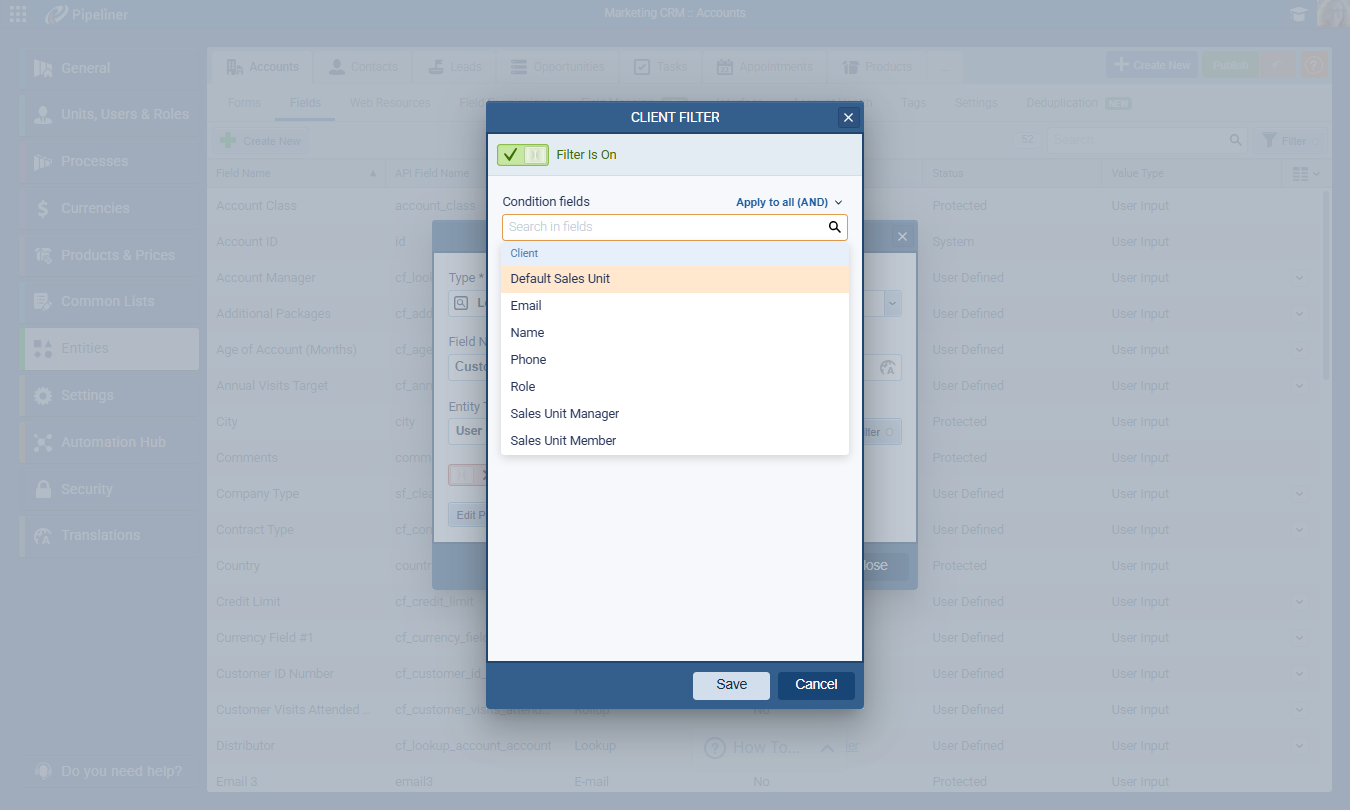
The fields that can be used for filtering include:
- Default sales unit › the user’s default sales unit
- Email › user email
- Name
- Phone
- Role › the assigned User Role
- Sales Unit Manager › where the user is a manager, or can manage selected sales units from the parent sales unit (keeping the management hierarchy)
- Sales Unit member › must be just a member of the selected sales units
Fullsize Screenshots ⤵
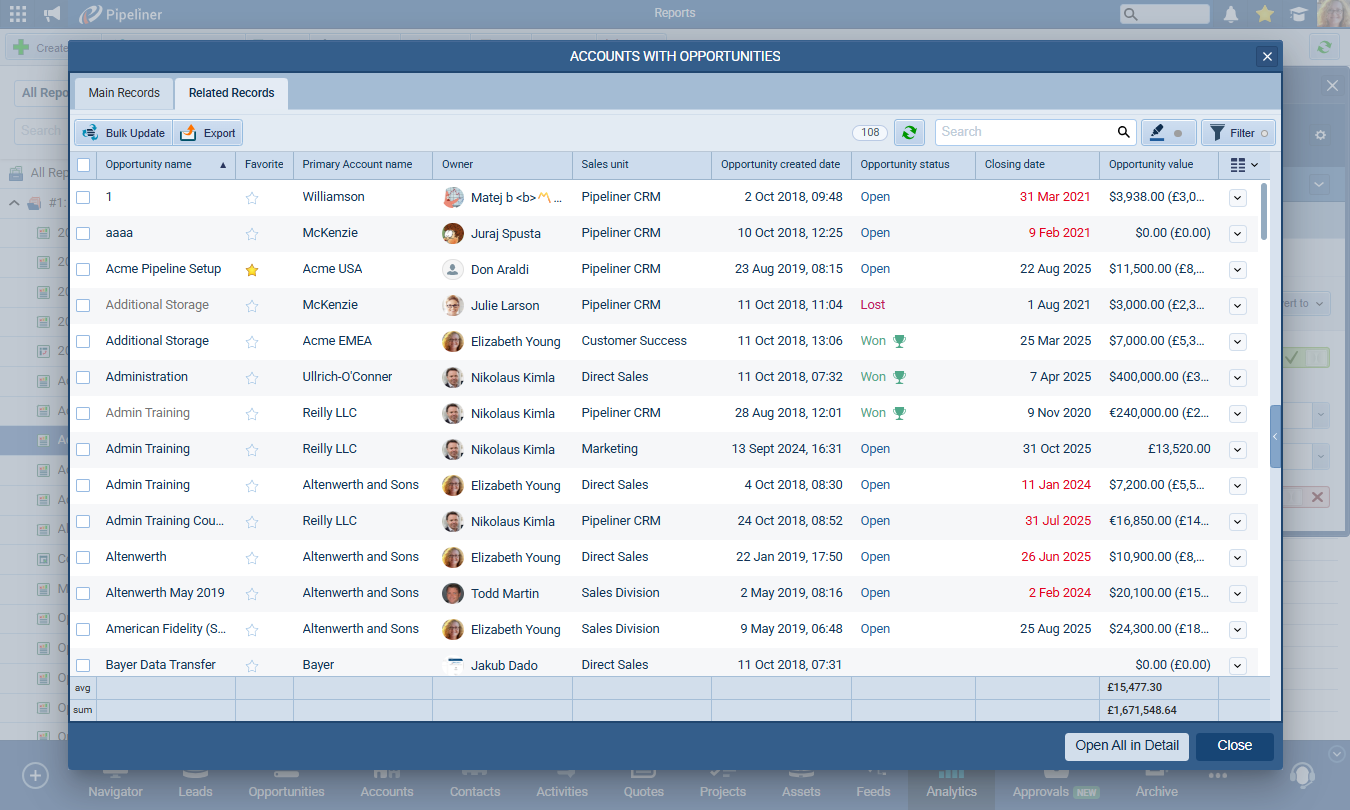
Reports & Dashboards › Drill-down Into Related Data
It is very common to access information from more than one entity or type of record in Reports & Dashboards. From this release, if a report includes the Value of a related entity, when drilling down into data from a chart, the user will see 2 tabs — Main Records which displays the main entity that the report is based on and Related Records which shows the related entity records that impact the report/chart.
Fullsize Screenshots ⤵
Various Improvements
As part of our ongoing usability enhancement program, we’ve updated the following features.
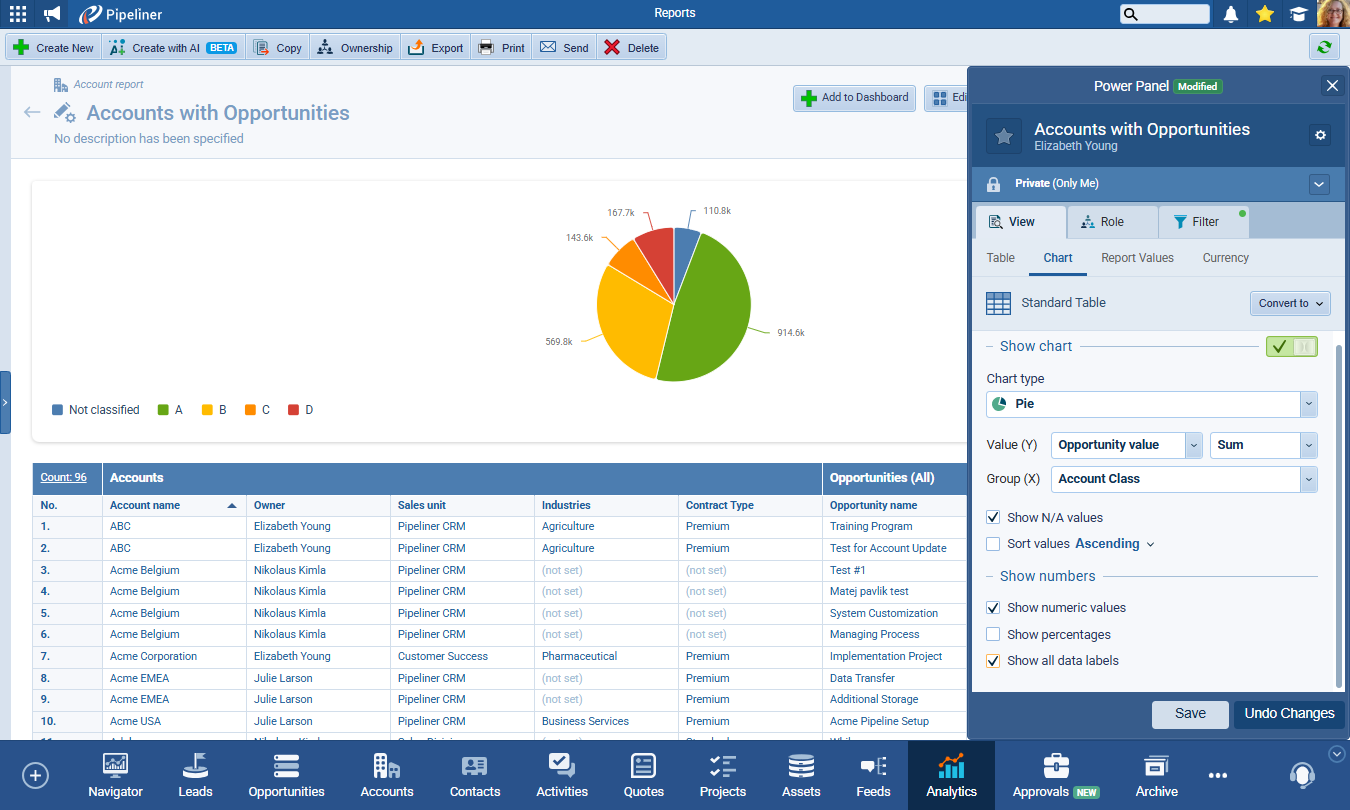
Displaying all data points in a chart
We’ve added a new option to help you see all values in your pie charts. In the Show numbers section, users will now find a checkbox “Show all data labels”. When enabled, this will display labels for every slice in your pie chart—no matter how small. By default, this option is turned off.
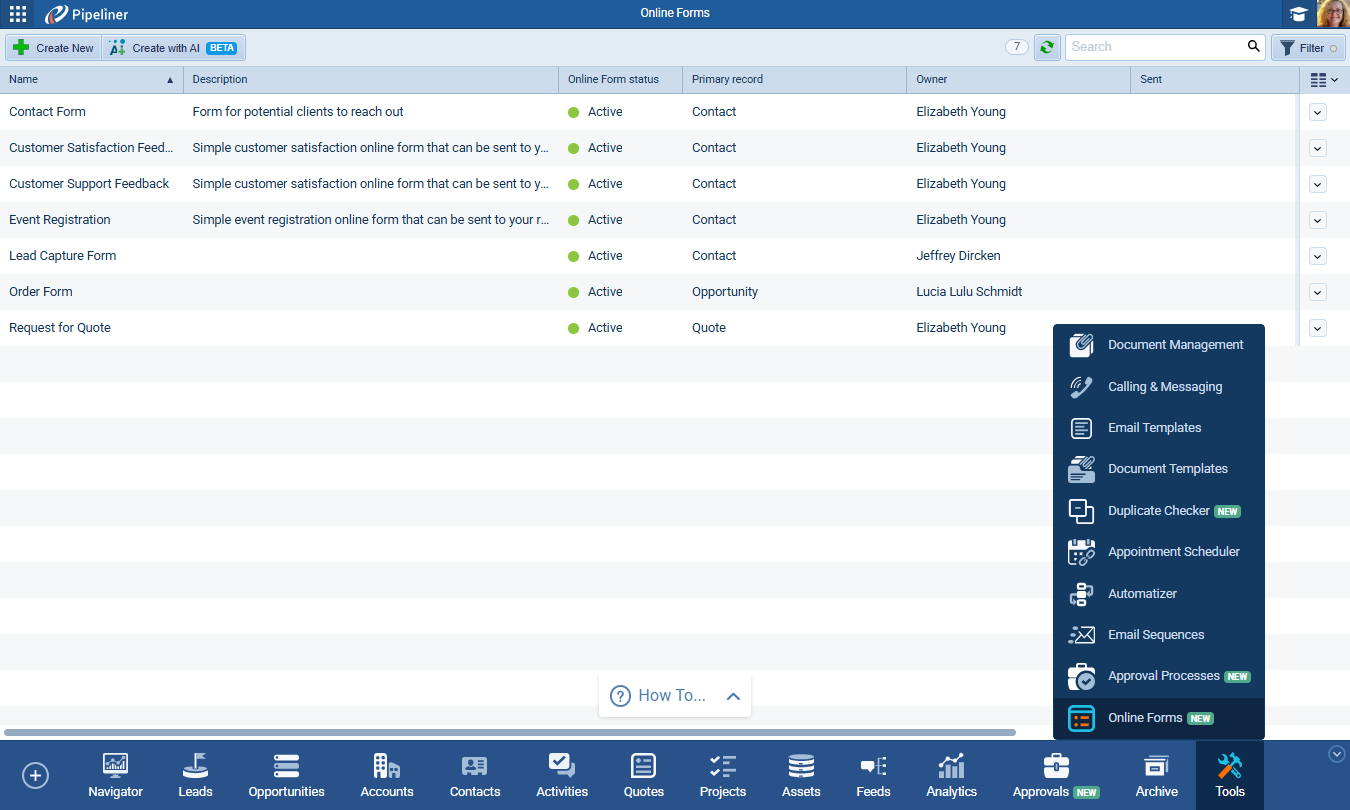
Bottom bar navigation in Tools
To help with navigating to and from certain Tools and other main menu options, the bottom main navigation menu bar now remains visible when you’re in:
- Automatizer
- Email Sequences
- Approval Processes
- Online Forms
When you’re in one of these Tools, the Tools menu will appear with the currently selected tool highlighted in the active state, making it easier to switch between areas without going back.
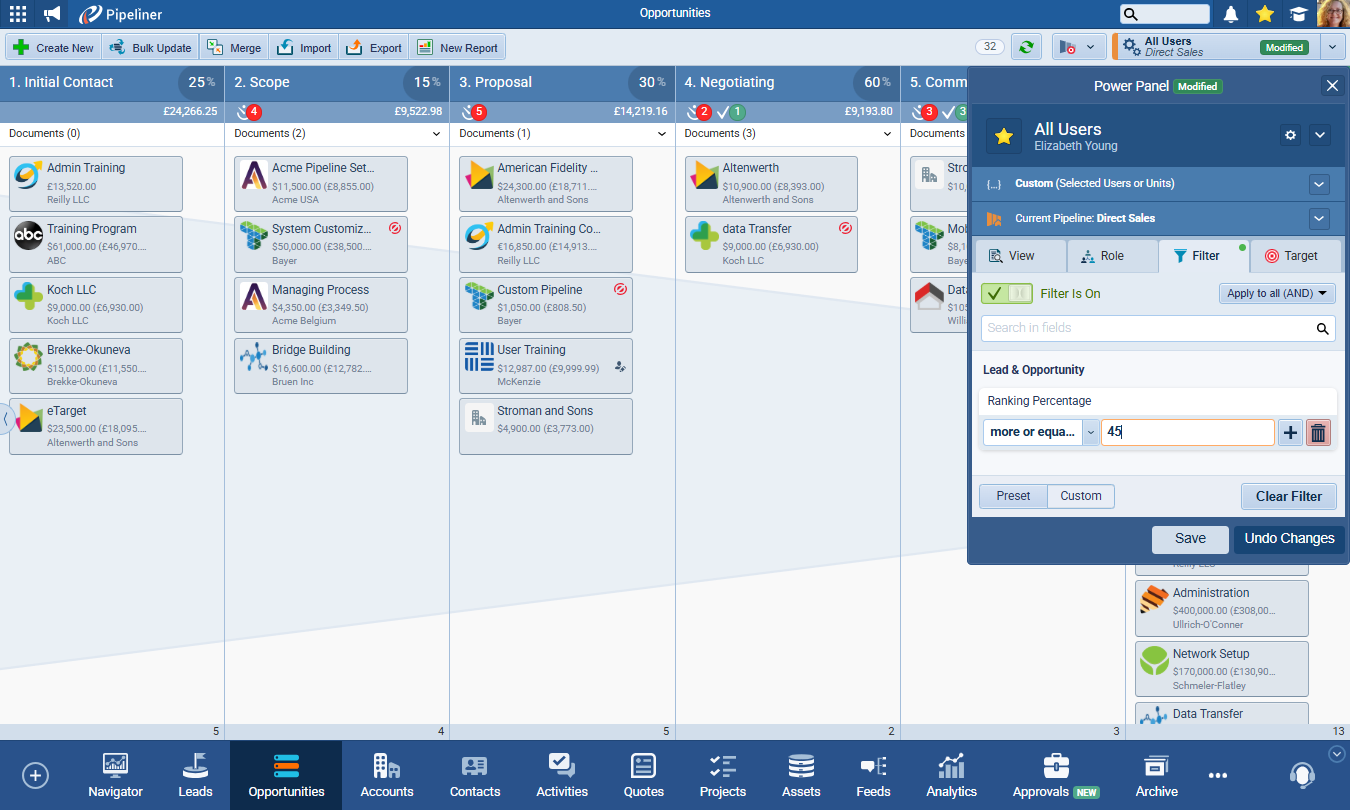
Filter Opportunities by Ranking Probability Value
A new Ranking Percentage field is now available in filters, allowing you to set precise numeric values and use all standard operators (e.g., “greater than,” “between,” etc.). This makes it easy to find records within a specific percentage range — such as 72% to 92% — for more accurate targeting. This field is available in both web and mobile filters for easy access.
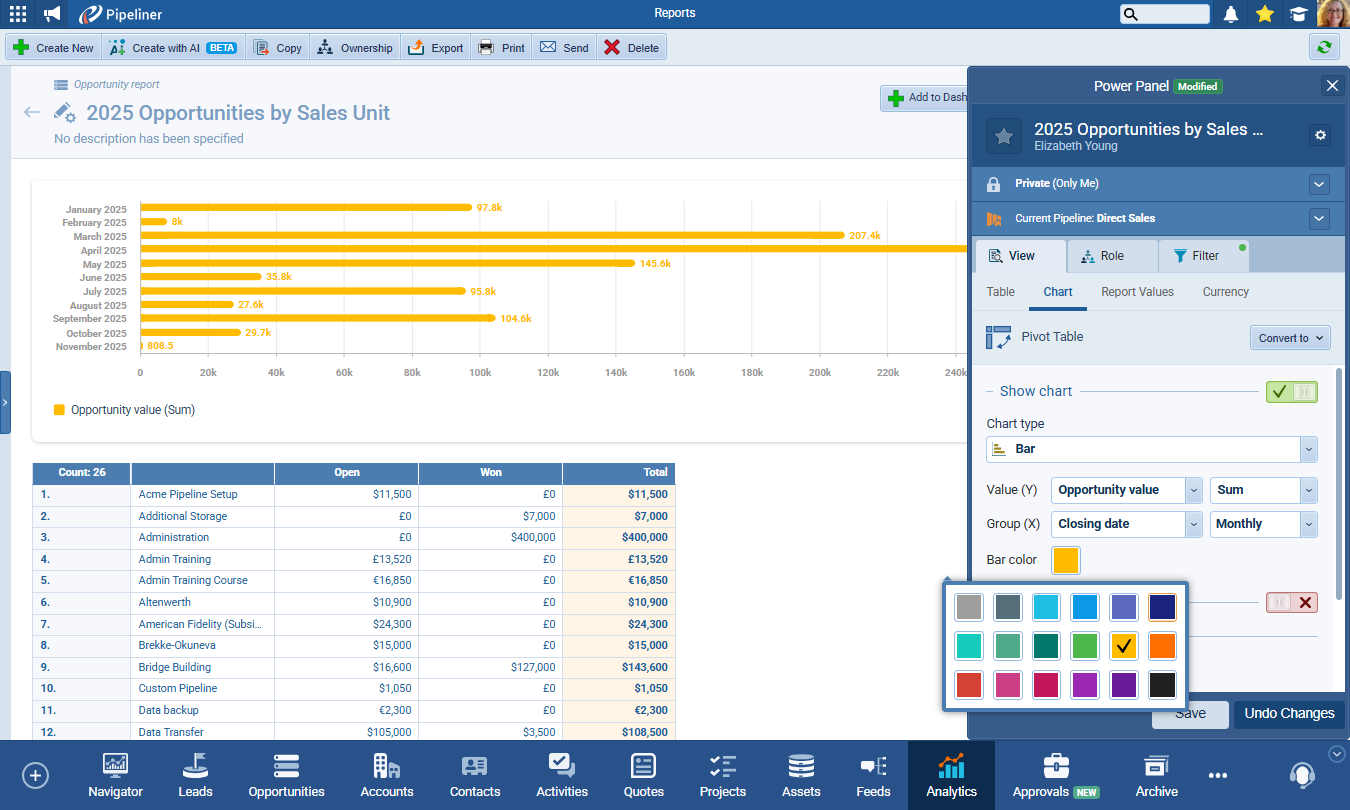
Custom Colors for Lines and Bars in Opportunity Charts
When setting up Line, Bar, or Column charts in Reports › View › Chart tab, you can now choose a custom color for your chart. The new color picker matches the one used for tags, with the default color remaining the same. This update also introduces a refreshed Show Chart section with the same functionality but improved layout.
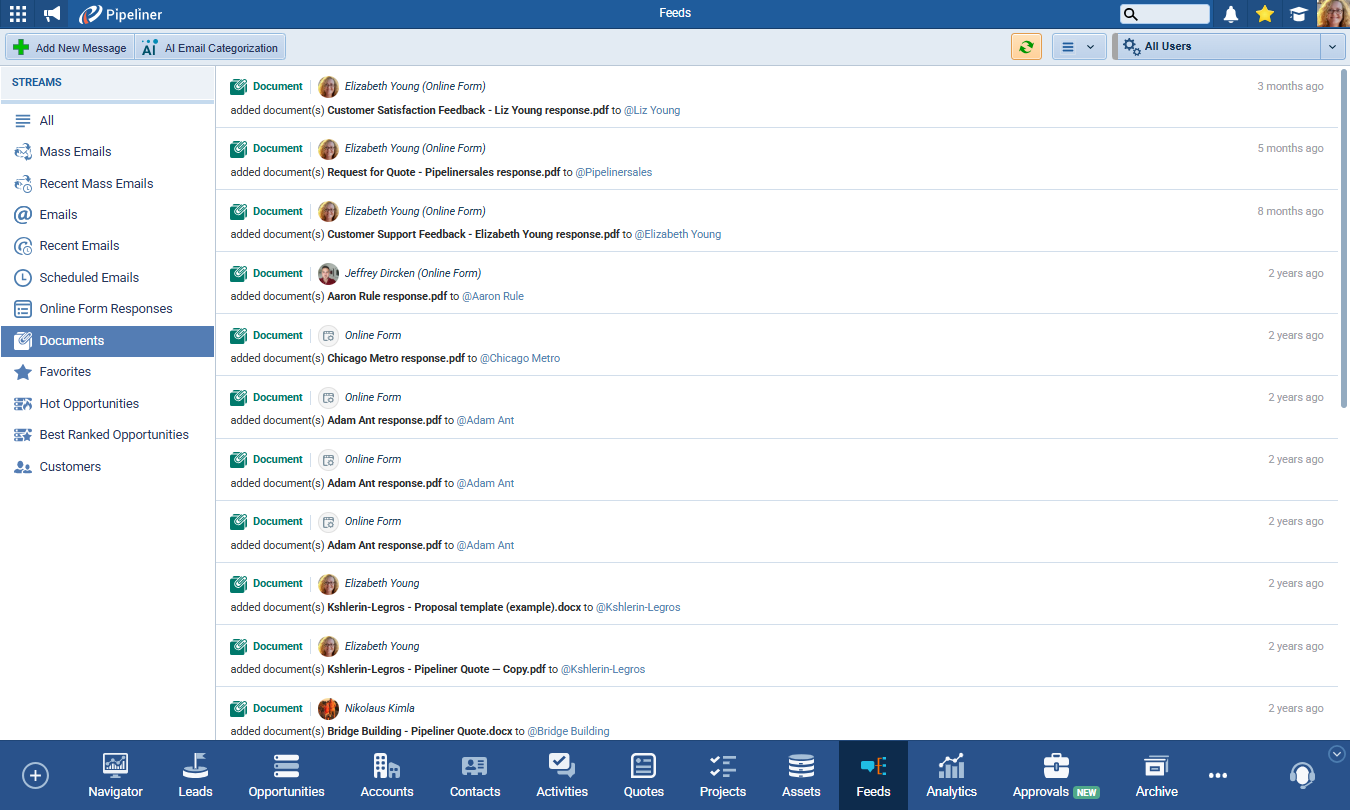
Refresh button on all screens
So that important content can be refreshed without needing to refresh the entire browser page, we have added Refresh button to multiple places in the application:
- Main screens › List views, Board views, Compact views, Matrix views, Map views and Feeds
- Tabs › List views, Org charts, Buying center and so on
- Drilldowns
- Reports
- Dashboards
Field Personalisation Options in Appointment Scheduler Appointments
Users can now personalize the Subject line of Appointments scheduled using Appointment Scheduler pages.
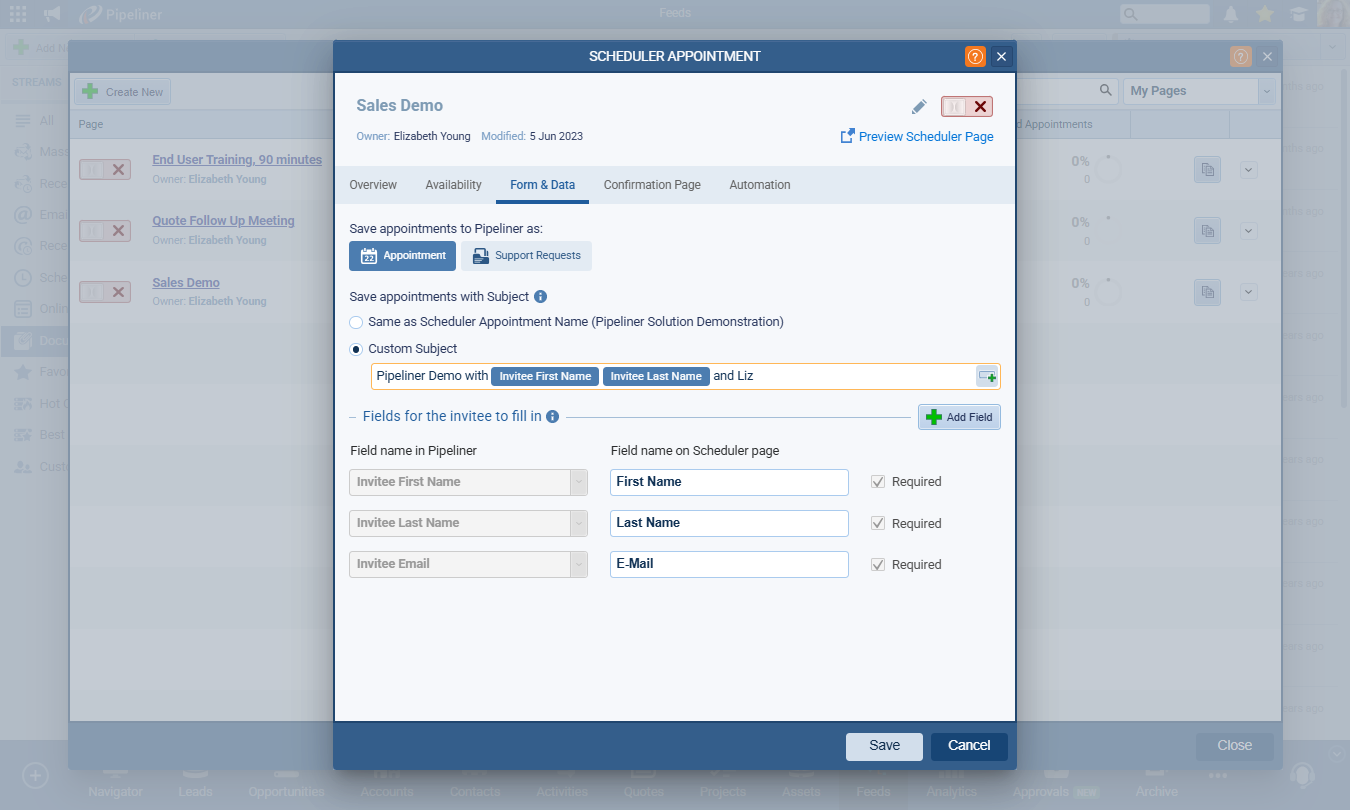
Personalization supports all available fields that can be used in the appointment scheduler form and if the user uses a field that is not on the form or is not filled out, it will be empty.
The personalised Subject line will show on the appointment itself and on notification emails and appointment confirmations.
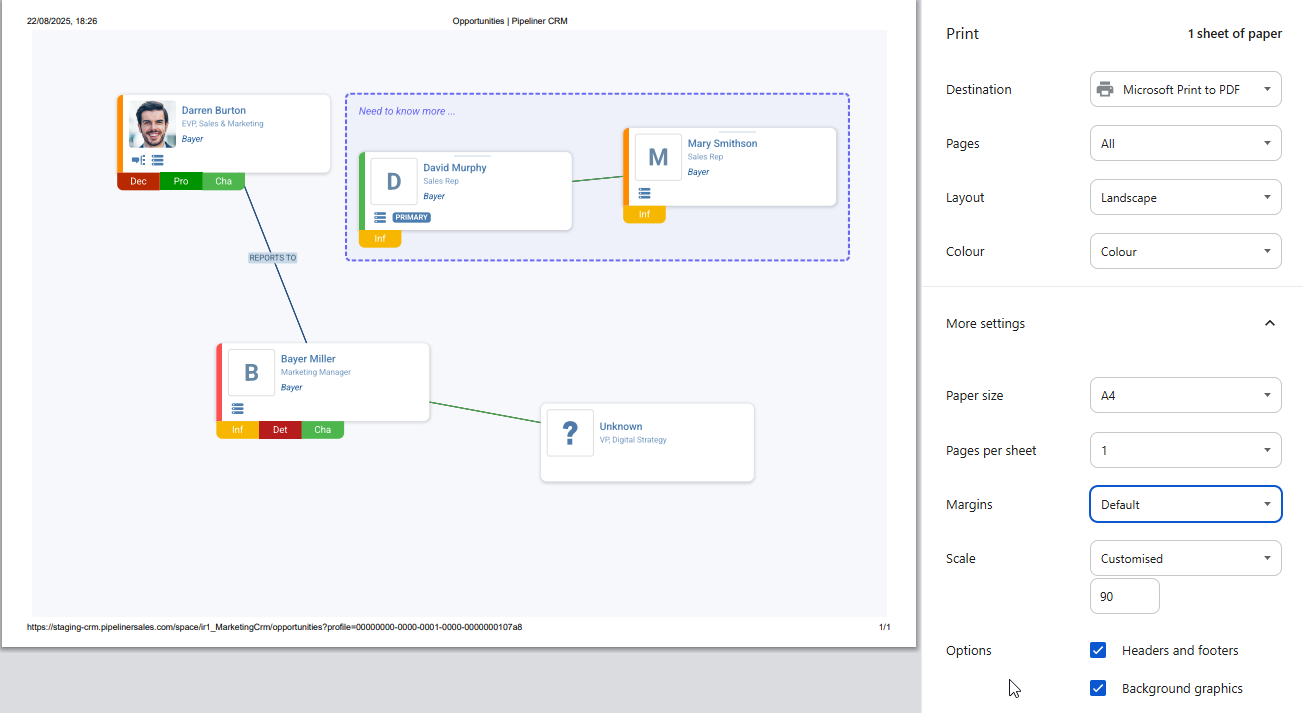
Option to print Org Charts, Relation Graphs and Buying Centers
We’ve added an option to print Org Chart, Relations Graphs and Buying Centers.
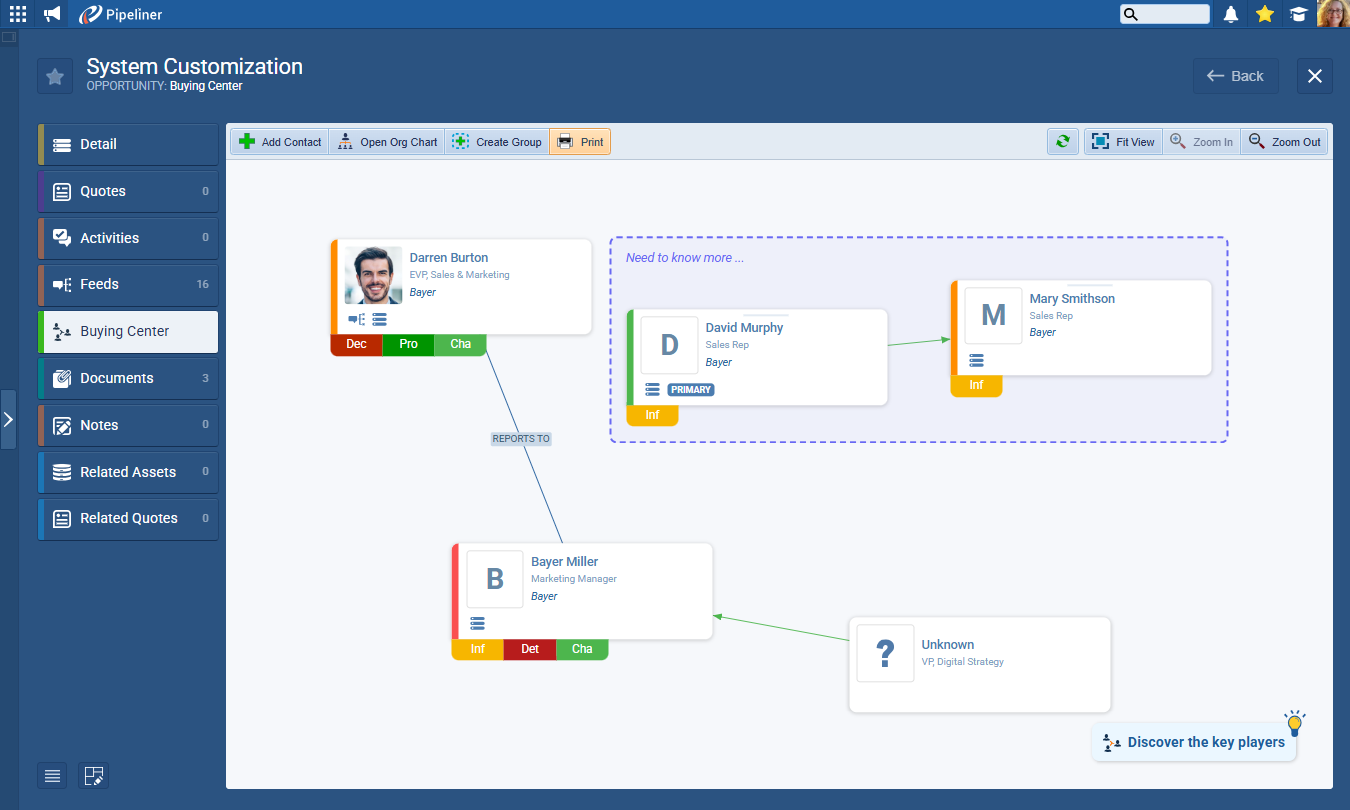
This Print action is using the default browser print functionality. Note it’s important to enable “Background Graphics”.
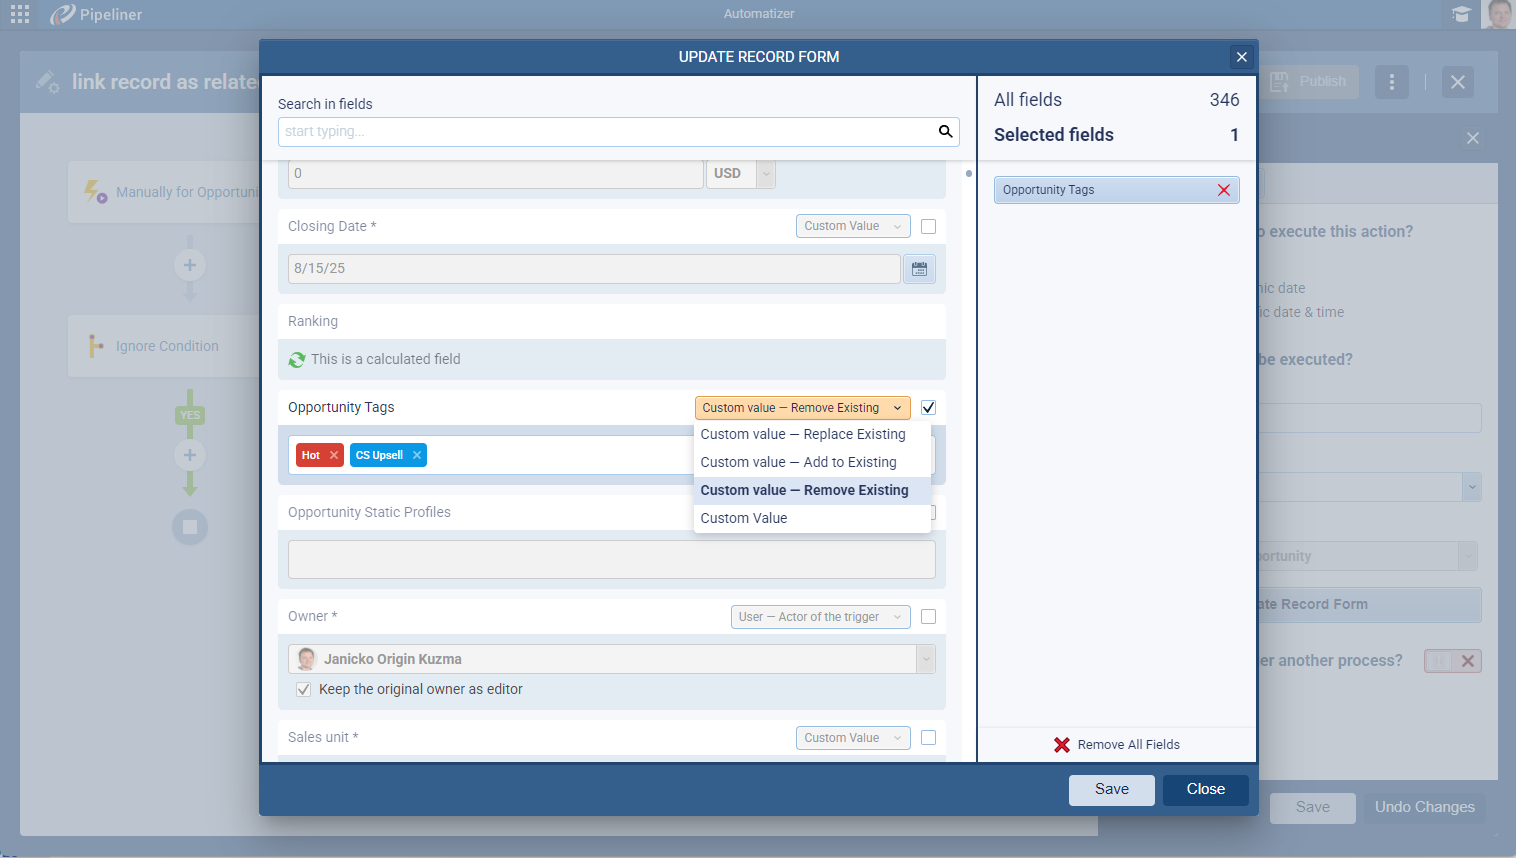
Automatizer › option to “Remove Existing”
New personalization field option in record forms — “Custom Value – Remove Existing”. Using this option will remove the chosen items from the respective field in the record. This is supported in all fields with multiple options (tags, multi-select, lookups, etc.).
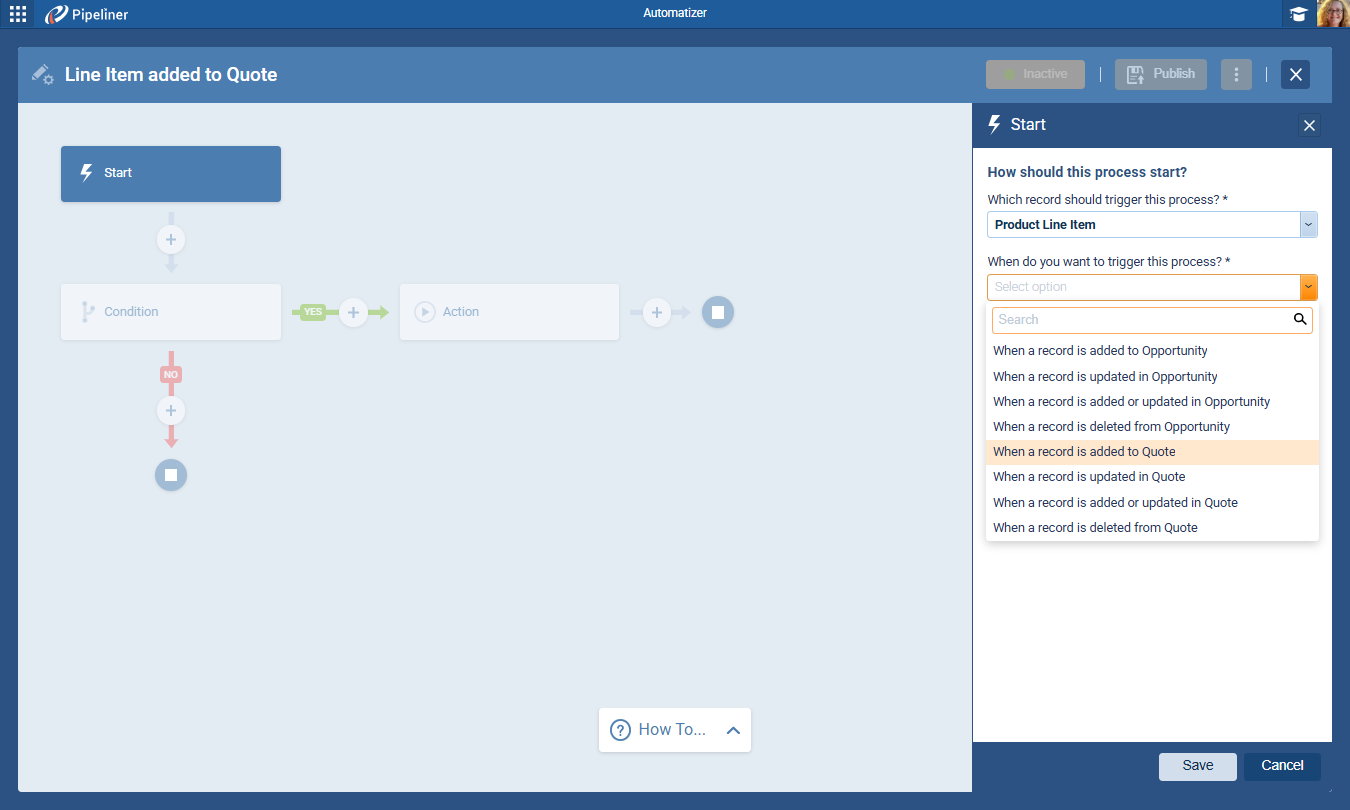
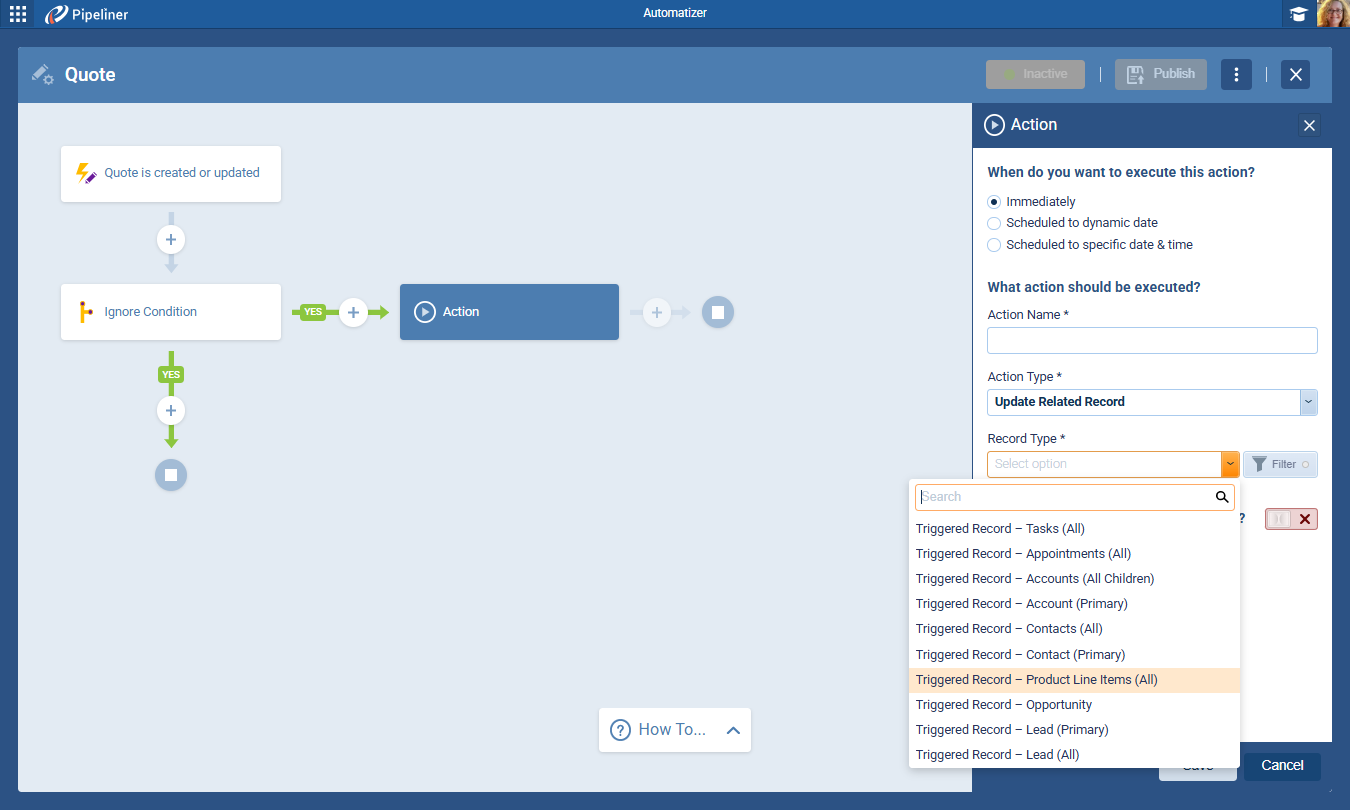
Automatizer: Improvements to Processes and Approval Process TriggersTriggers Triggers are a set of signals or occurrences that meet certain criteria to be considered an opportunity to make a sale. when using Quotes
When using ProductProduct Product refers to anything (an idea, item, service, process or information) that meets a need or a desire and is offered to a market, usually but not always at a price. Line Item as the process entity, the following triggers are now available:
- When a record is added to Quote
- When a record is updated in Quote
- When a record is added or updated in Quote
- When a record is deleted from Quote
Additionally, when the process entity is Quote and the action is Update/Create Related Records, Product Line Items are now available to be created/updated.
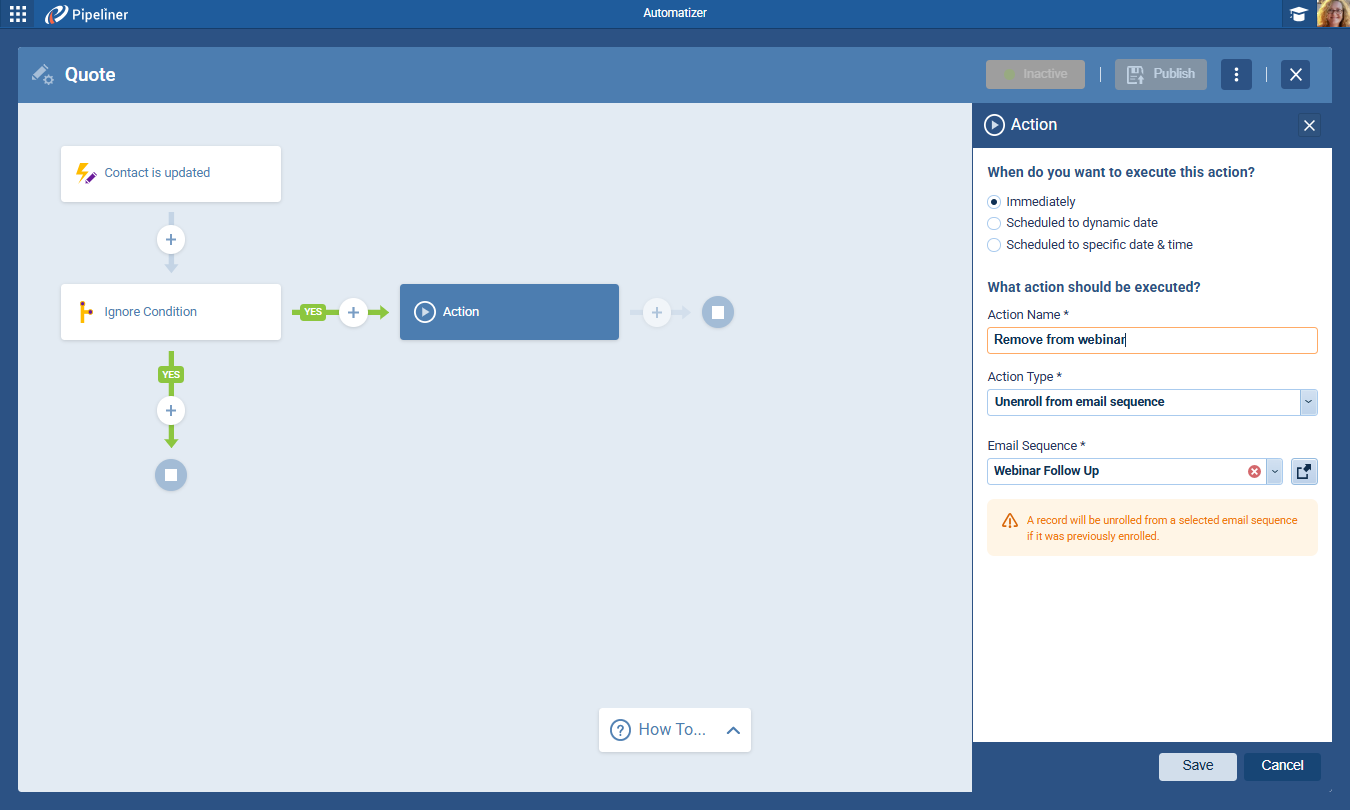
Automatizer: New Action Type “Unenroll record from email sequence
This new action will un-enroll the triggered record from the selected sequence (if the record exists in the queue).
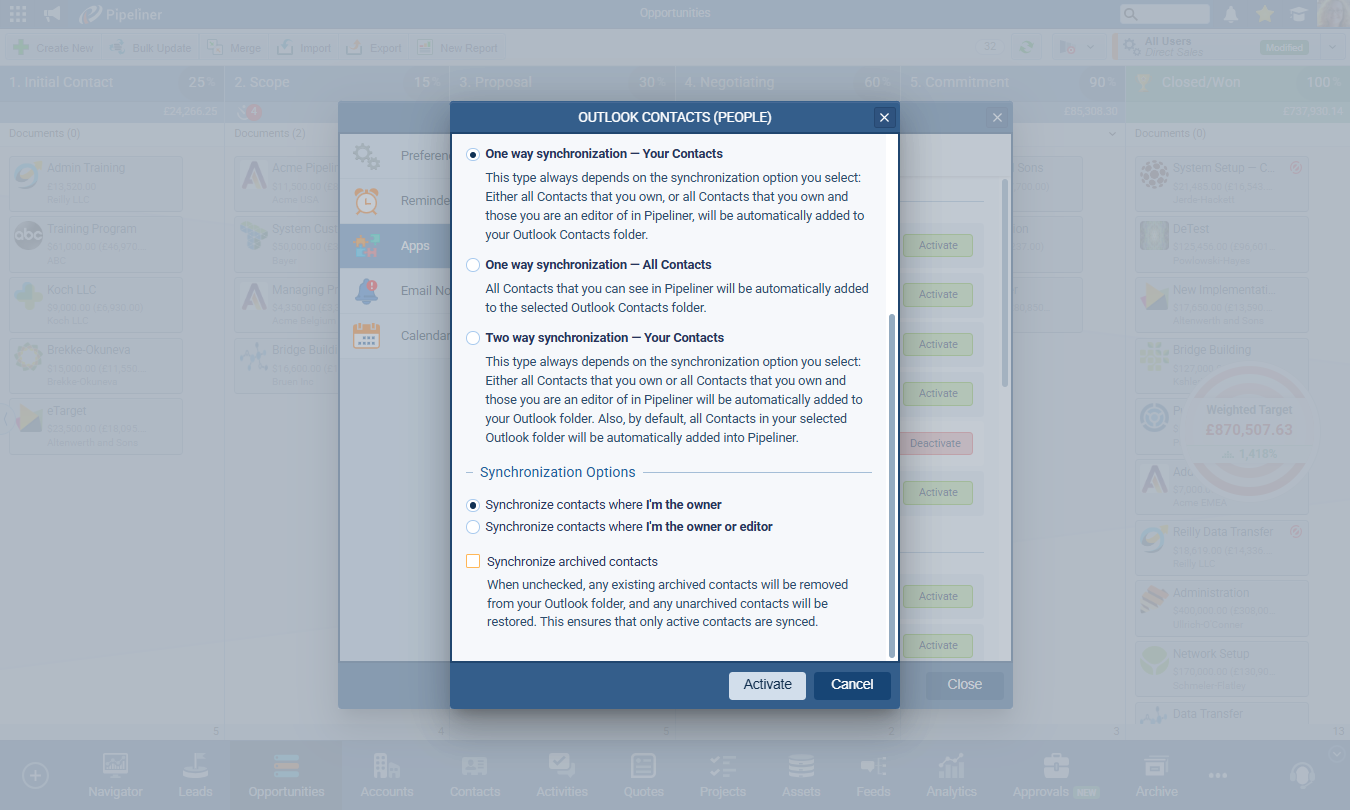
Outlook Contact sync (O365 Contacts) › Add option to skip syncing archived contacts
From now on, users can uncheck the option “Synchronize archived contacts”, which changes the default sync behaviour.
When unchecked for a sync process that is already active:
- What is in the archive system will be removed from the Outlook folder
- What is unarchived will be restored to the Outlook folder
When unchecked before activating the integration for the first time:
- What is in the archive system will not be synced
- What is unarchived will be restored in Outlook
Improvements to Entity Export
We have improved the exporting tool so that it now includes a Columns selector. For Contacts, there is also a name format selector.
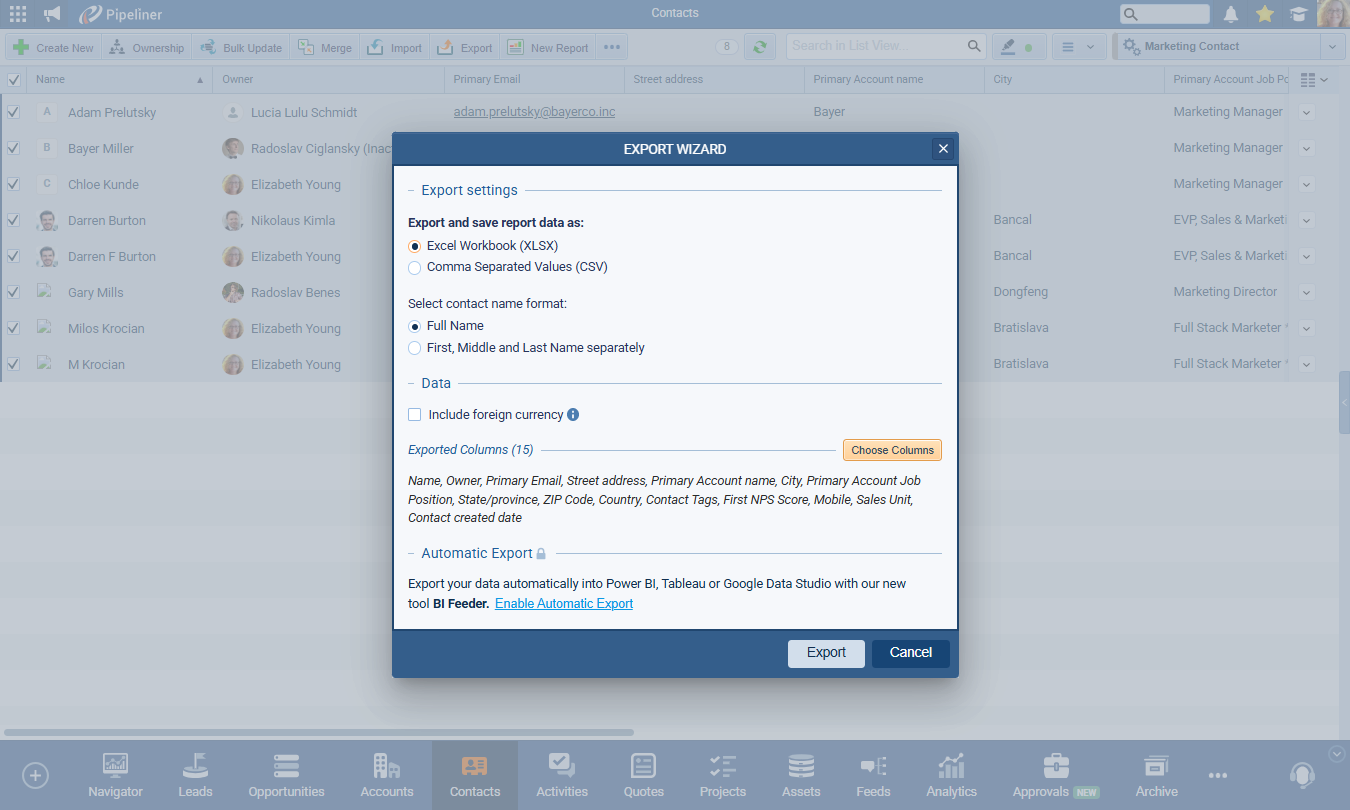
By default, the export will include visible columns on the current screen but the user can override this default setting and choose any columns from all available columns.
Copy Record Confirmation
We’ve added a new confirmation dialog to the Copy record action for all record types to prevent accidental clicks.
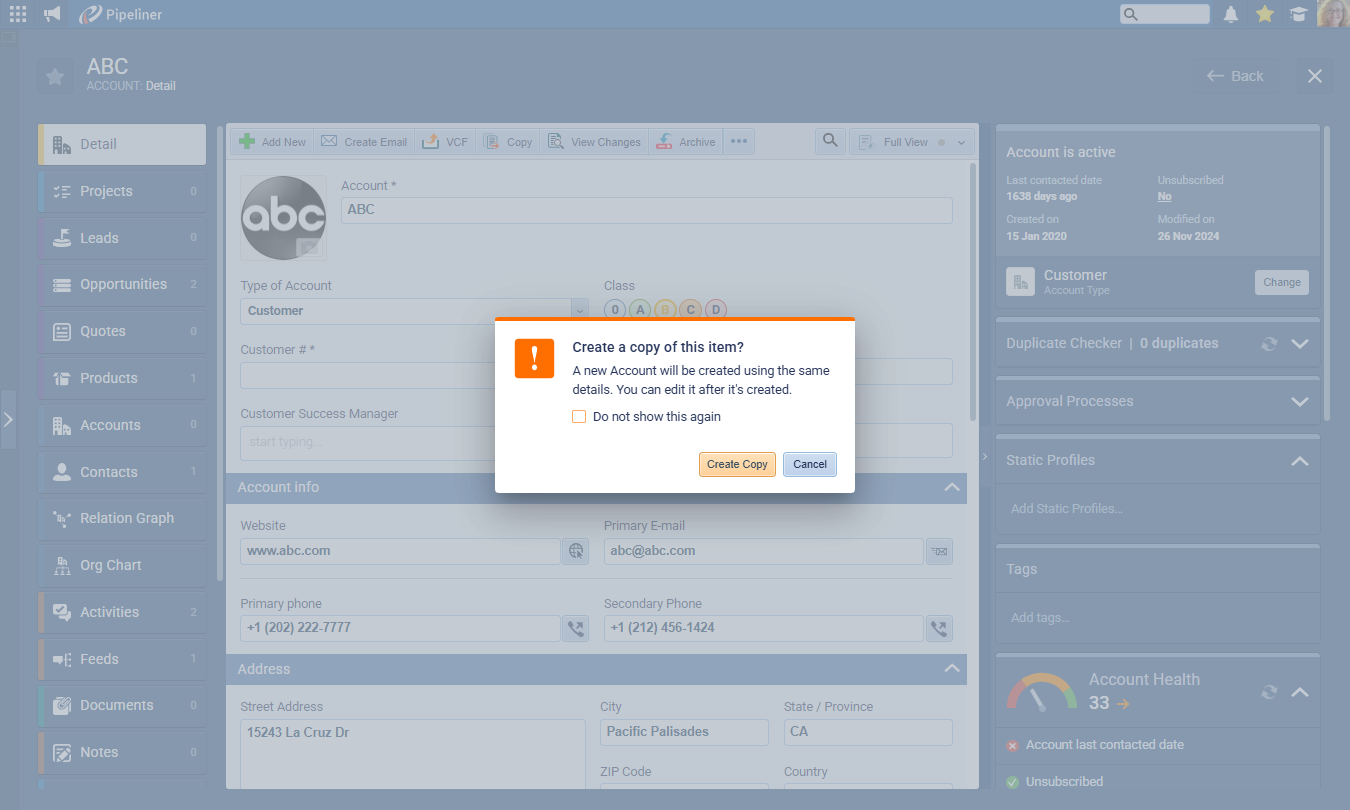
The user can also select the “do not show again” option.
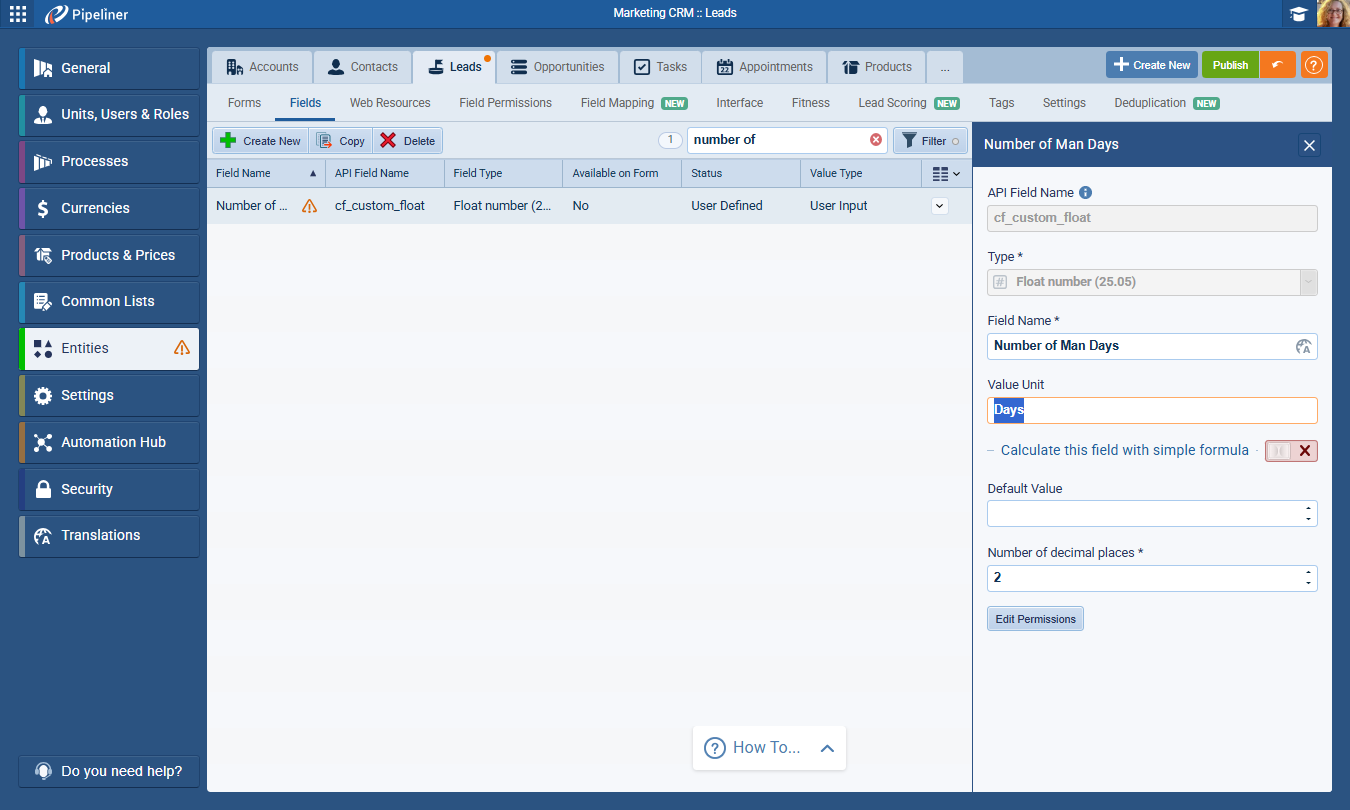
Unit Labels for Number fields
Any integer or float field can have a unit label added to the end of the field in the Field Properties in the Admin Module.
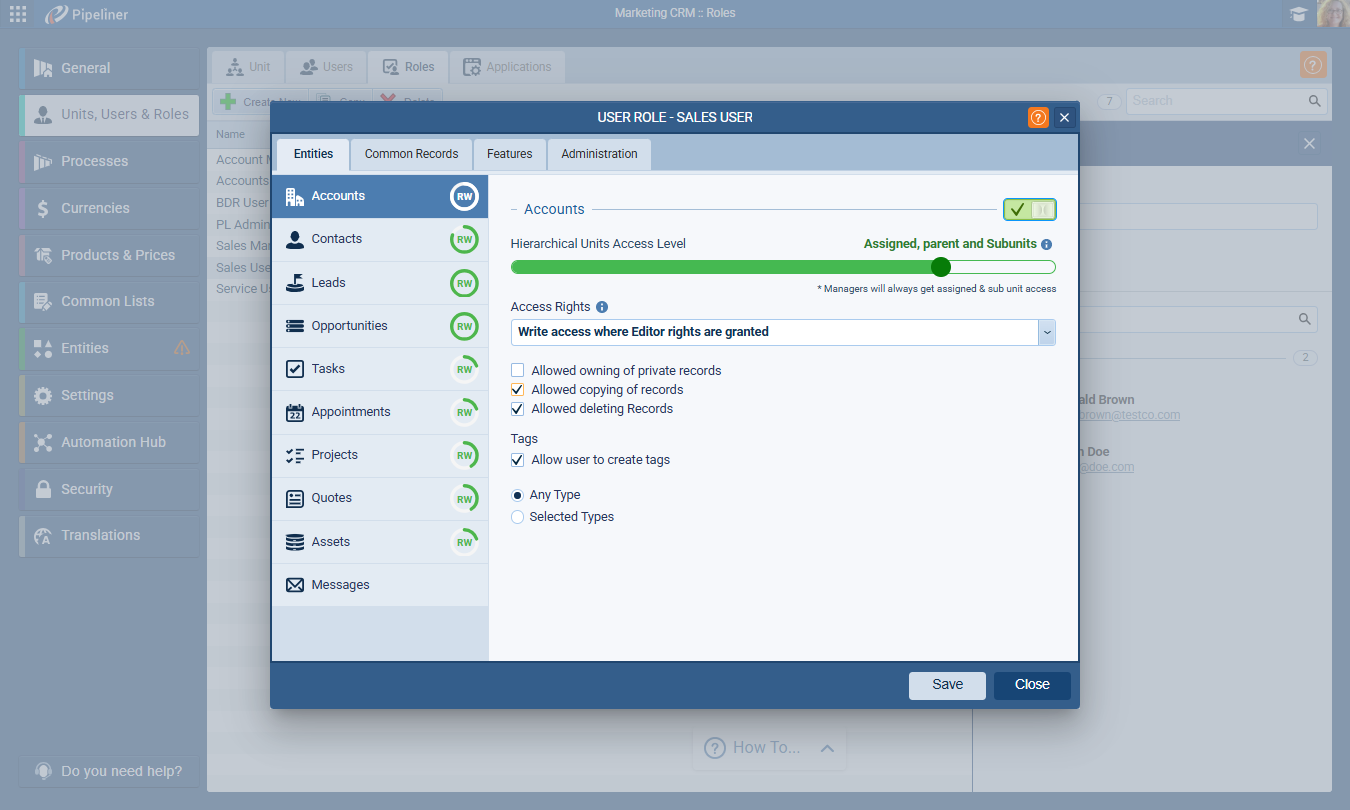
User Roles › Allow/Disallow Copying of Records
The ability to copy records is now included in User Roles and can be allowed/disallowed for each role.
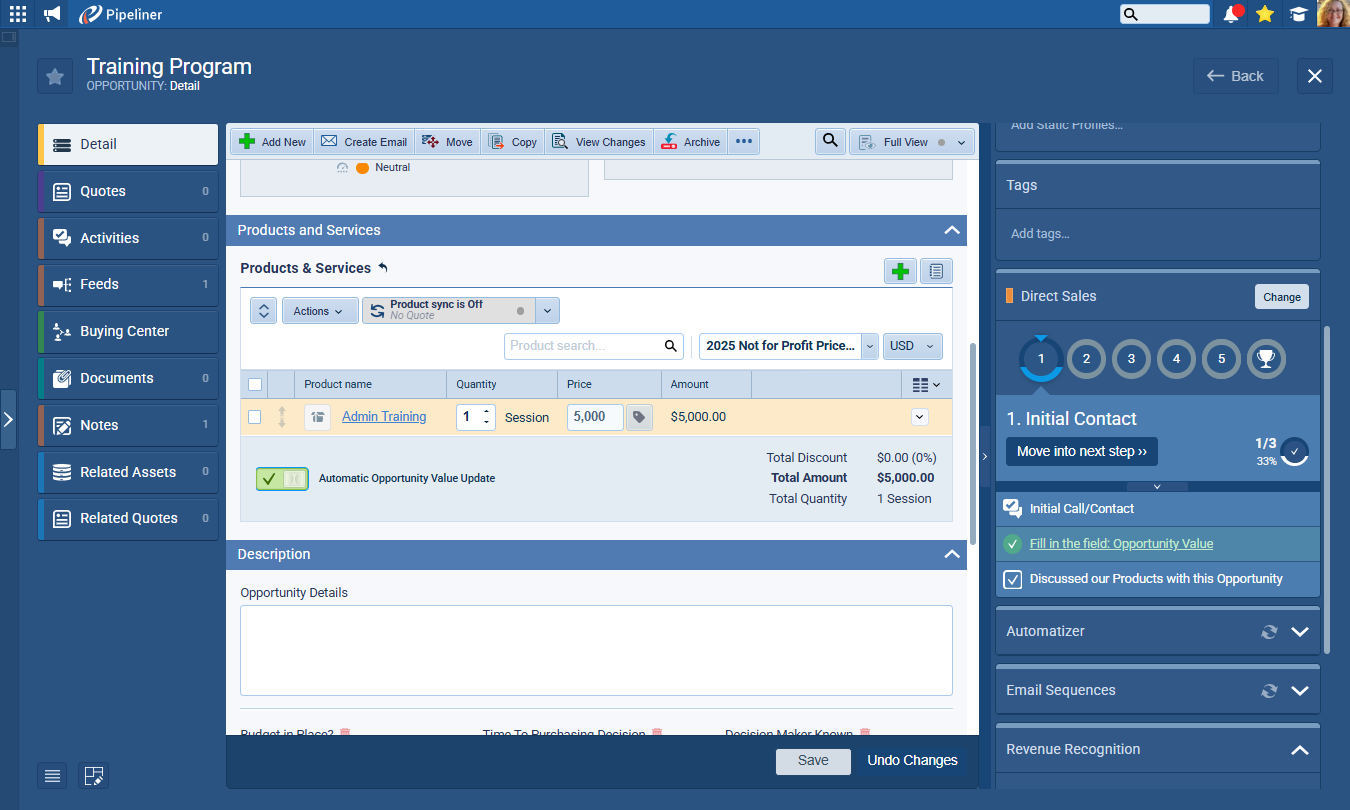
Restrict DiscountDiscount Discount means a promotional reduction in the cost of a product or service, commonly deployed to speed up sales./Price Increase for Product Line Items in Opportunities/Quotes
Within each price, Admins can determine which User Roles allow access to the ability to discount/increase prices of each line item when using a particular price list(s).
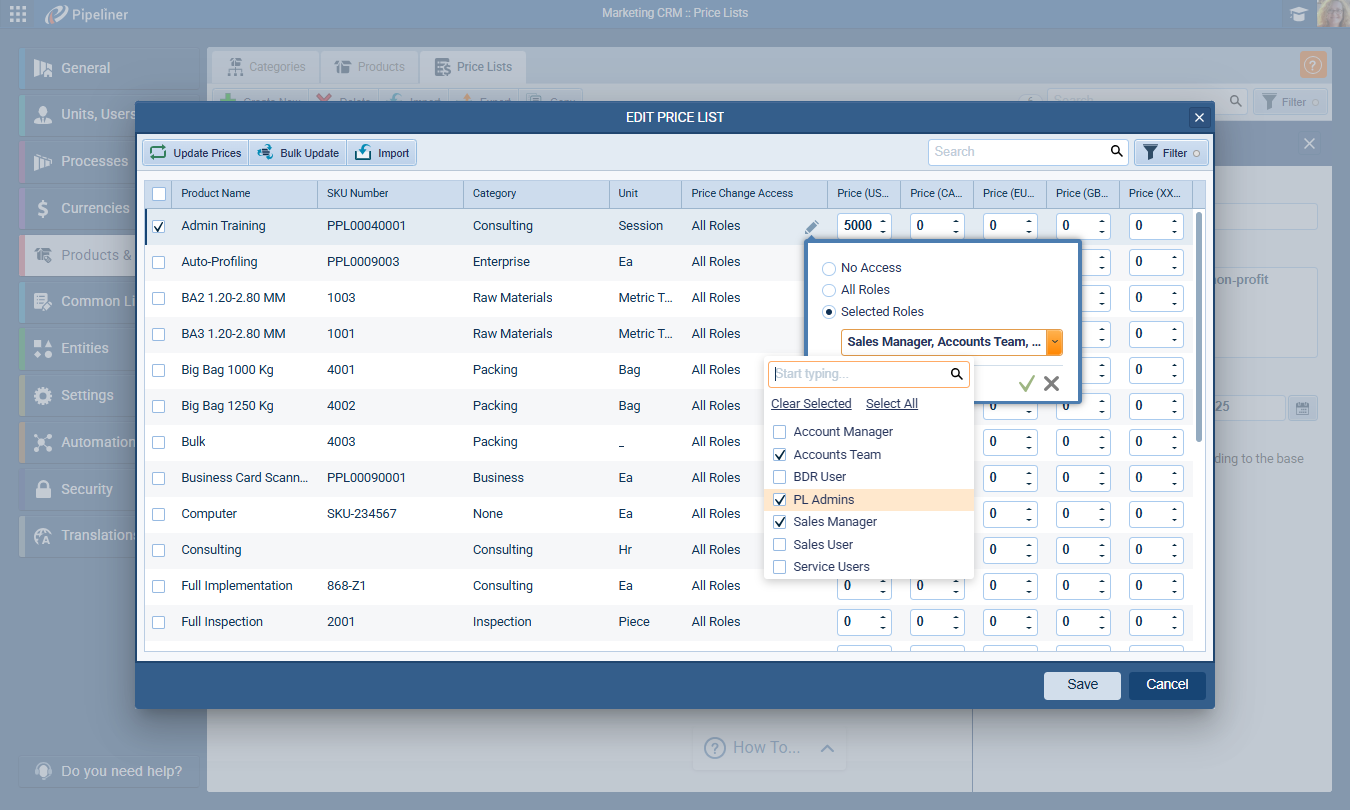
When Price Change Access is disabled for a Product within a Price List for a particular User Role, any user based on that Role will not be able to alter the list price of that Product when using it in Opportunities and Quotes.
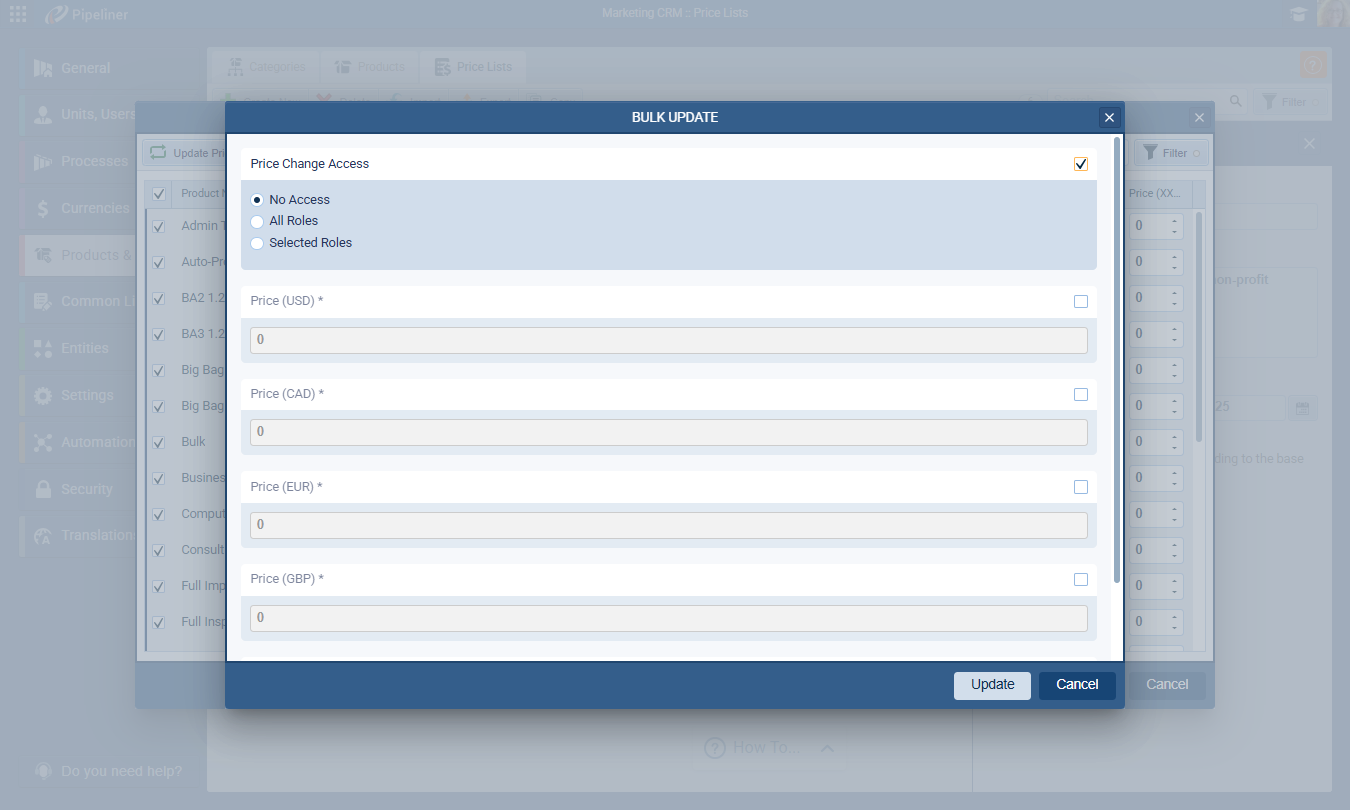
Bulk Updates to Price Lists
Admins can now bulk update Price Change Access (the ability to discount or increase list prices) as well as the price in any currency for every product in the selected price list.
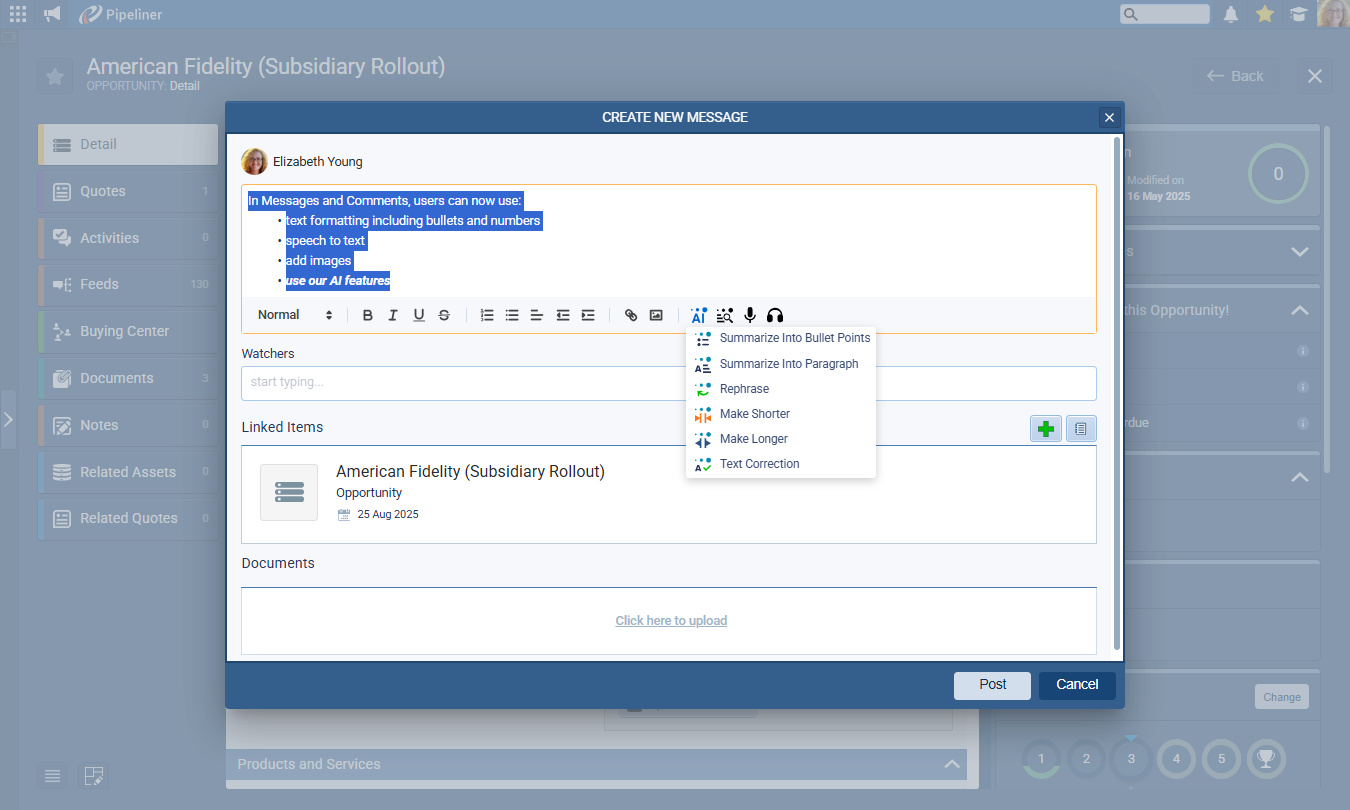
Rich Text Editor in Messages and Comments
Users can use the rich text editor in messages and comments throughout the entire application.
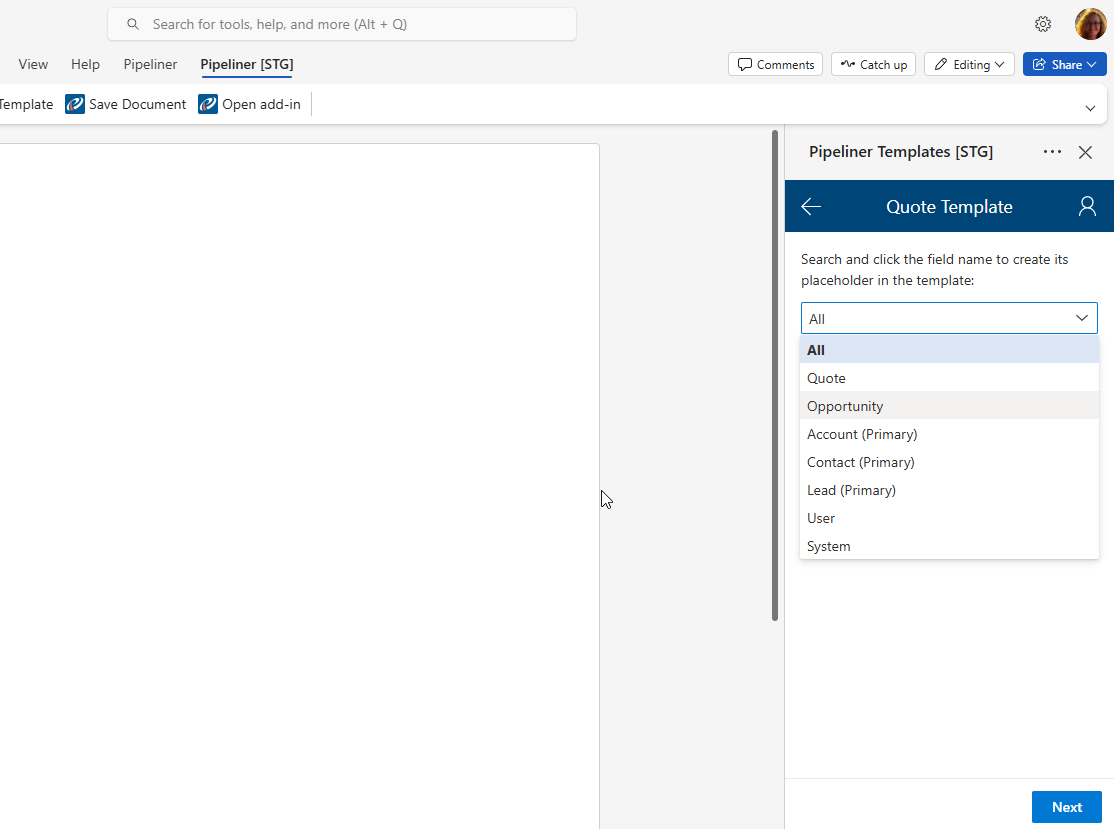
Quote TemplateTemplate Template is a generic file with a framework showing the standard sections or features of a specific kind of document, used to create a new document of the same type faster and easier. Improvement
In Google and Office templates, users can now use Opportunity fields in Quote templates.
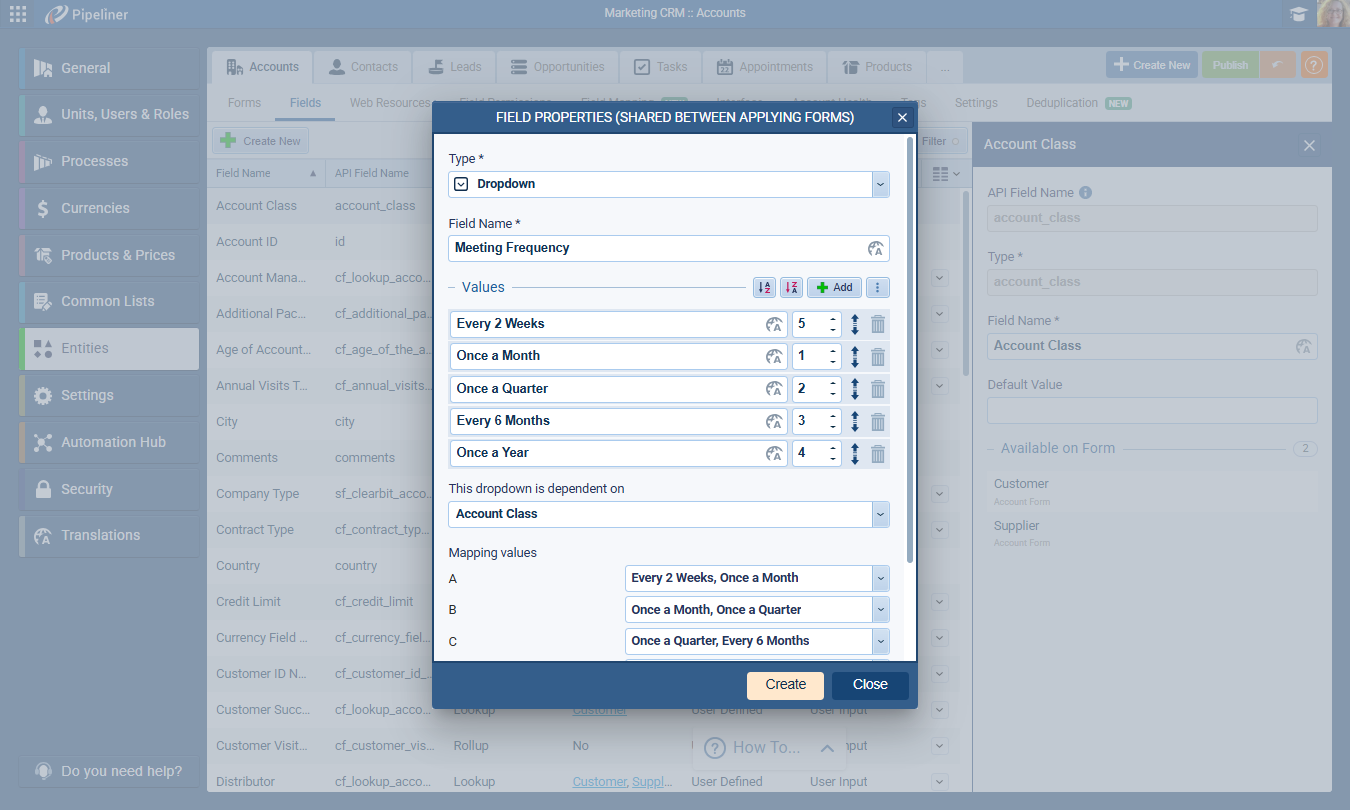
Entities: Allowing Parent/Child Dependences for Protected/System Dropdown Fields
When creating custom dropdown fields for Entities, Admins can now make field values dependent on the values selected in system/protected fields (not just other custom dropdowns).
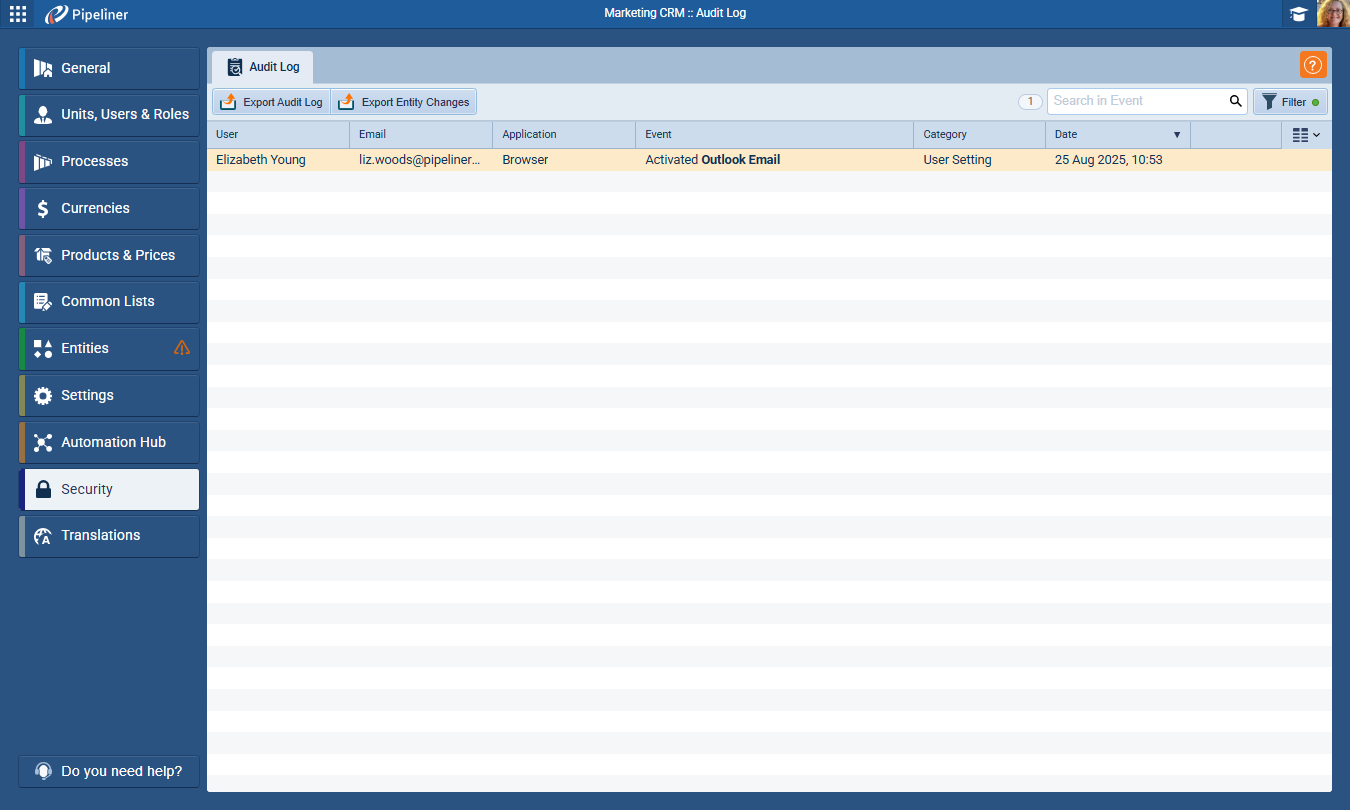
Admin › Ability to see enabled integrations from the Security Tab
In Admin › Security, admins can now see which integrations have been enabled by users. A new Filter option “User Setting” is available in Category.
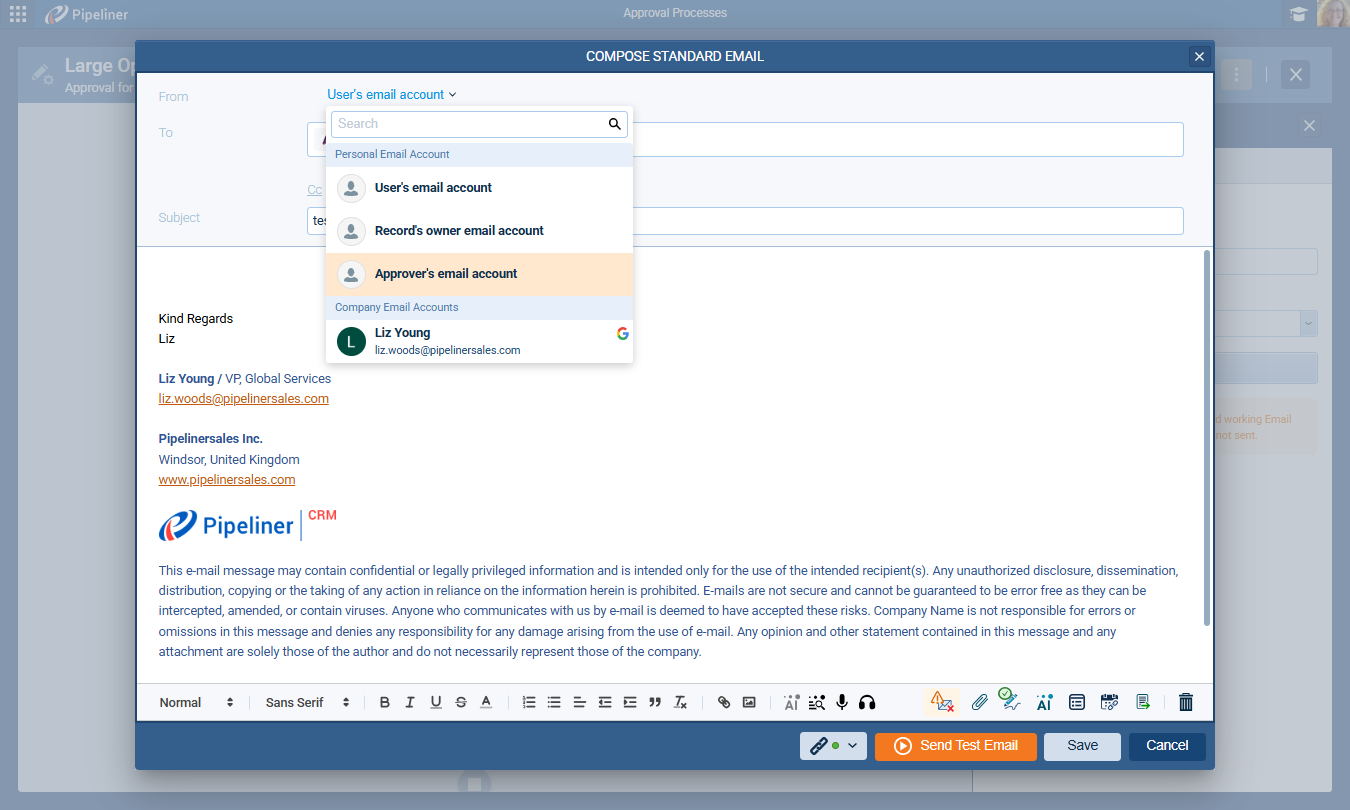
Approval Processes: ability to send email from the Approver’s email accountAccount Account refers to a record of primary and background information about an individual or corporate customer, including contact data, preferred services, and transactions with your company.
We’ve added an additional option when sending email as an action of approval process. Approval Managers can now select “Approver’s email account” as the sender of the email message.
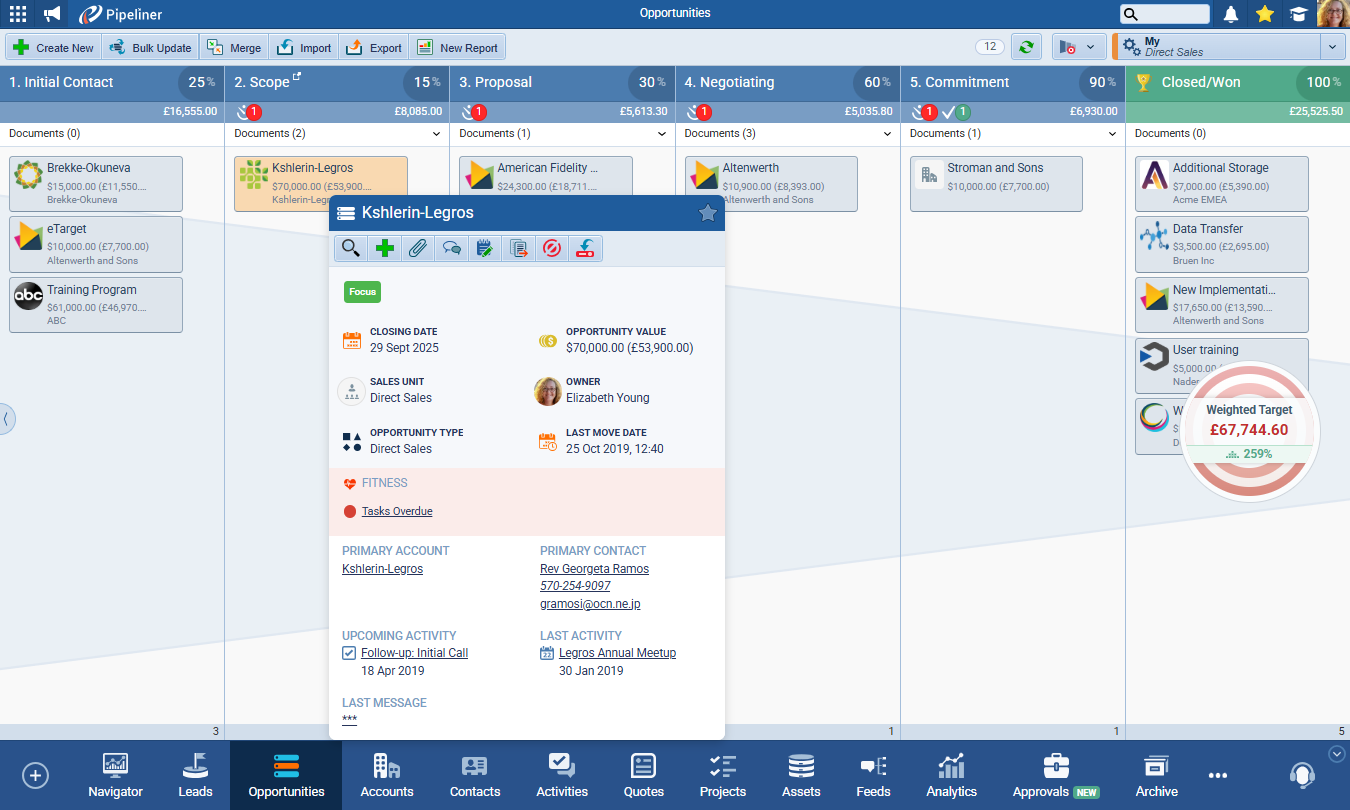
General Use: Toggle Off Hover
Users can now disable record tooltips in entire application in User Settings.
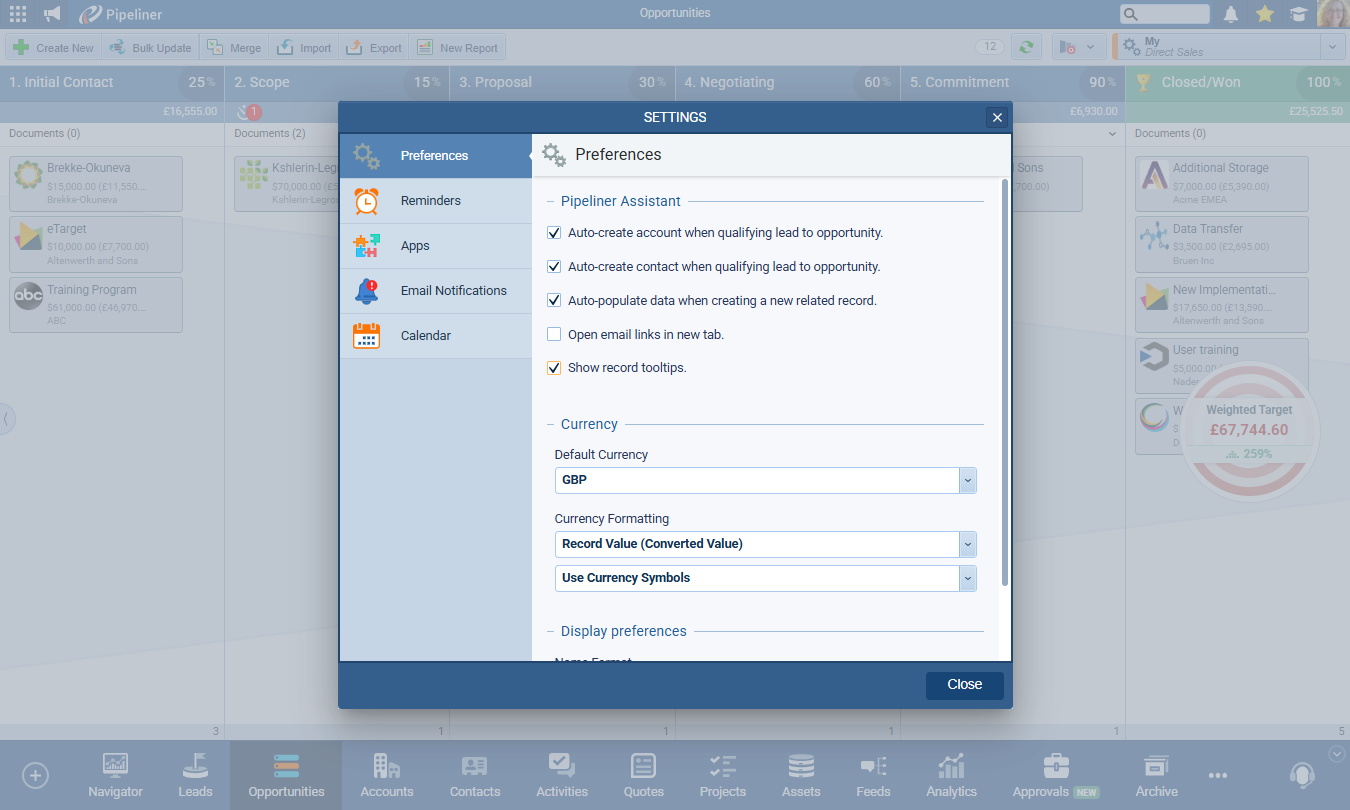
When switched off, hovering over a record will not display the tooltip/Quick View shown below.
Fullsize Screenshots ⤵