March 31st, 2021
We are happy to announce the v3.10.0 release of Pipeliner CRM.
This release includes another exciting batch of new features for our app as well as other improvements to existing functionality.
Please note that some of these features are only available for our Business or EnterpriseEnterprise Enterprise (in the context of sales) is a relatively large organization typically composed of multiple levels, locations, and departments which need multi-layer software systems that support collaboration across a large corporate environment. Tiers.
New Features and Small Enhancements
AccountAccount Account refers to a record of primary and background information about an individual or corporate customer, including contact data, preferred services, and transactions with your company. Matrix
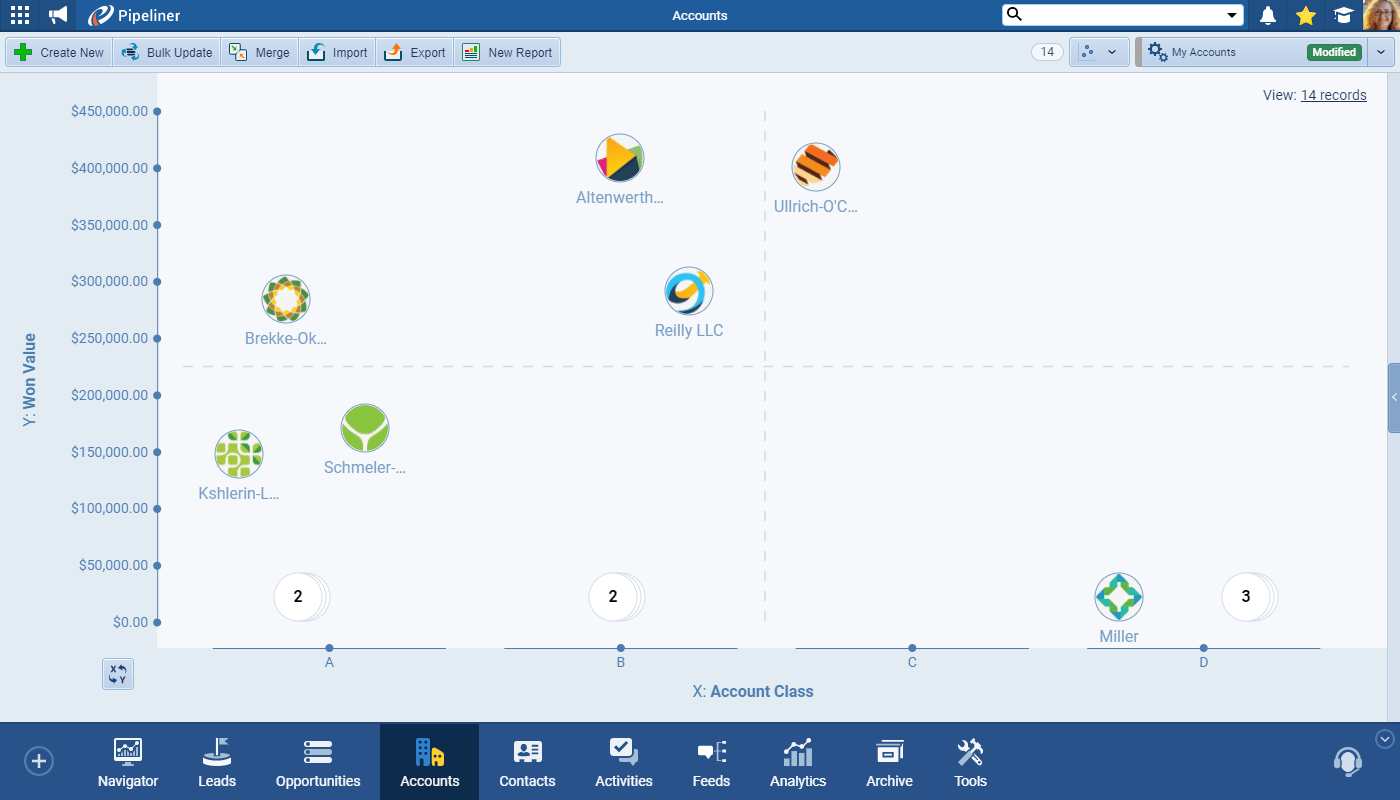
We’re now extending the power of visualisation to Account Management in Pipeliner. The first step is the new Accounts Matrix View.
Users can select their own criteria to segment their Accounts into different views depending on their use case. Some scenarios might include:
- Customer SuccessCustomer Success Customer Success is a proactive mindset, function, department or strategy commonly adopted by B2B companies to optimize business with customers, reduce churn rate, drive profits and increase the predictability of recurring revenue. users choosing to display Accounts based on their total Won Opportunity value and the number of Days or Months until renewal so they know where to focus & plan their next actions.
- The Sales team might want to prepare their Account Plans based on Account Class & Annual Won revenueRevenue Revenue is the amount of money a business generates during a specific period such as a year or a quarter; also called sales..
- Account Managers might want to see how many days have passed from the Last Contacted Date by Account Class to prioritise their calling plans.
Account Matrix Options
- Choose from system and custom fields (dropdowns, numbers, dates) to select the X-Axis & Y-Axis definitions.
- Show or hide the segmentationSegmentation Segmentation is the process of subdividing a large market into distinct partitions (or segments) based on demographics and other factors, with the aim of formulating and implementing separate strategies to better engage the consumers in each segment. grid and Account Names.
- Choose the display option for the Bubble in the Account matrix based on Account Image, Class, or Owner.
- Select the axis ranges or dropdown options to focus on specific ranges.
- Swap the X and Y-axis.
Forecasts & Quotas
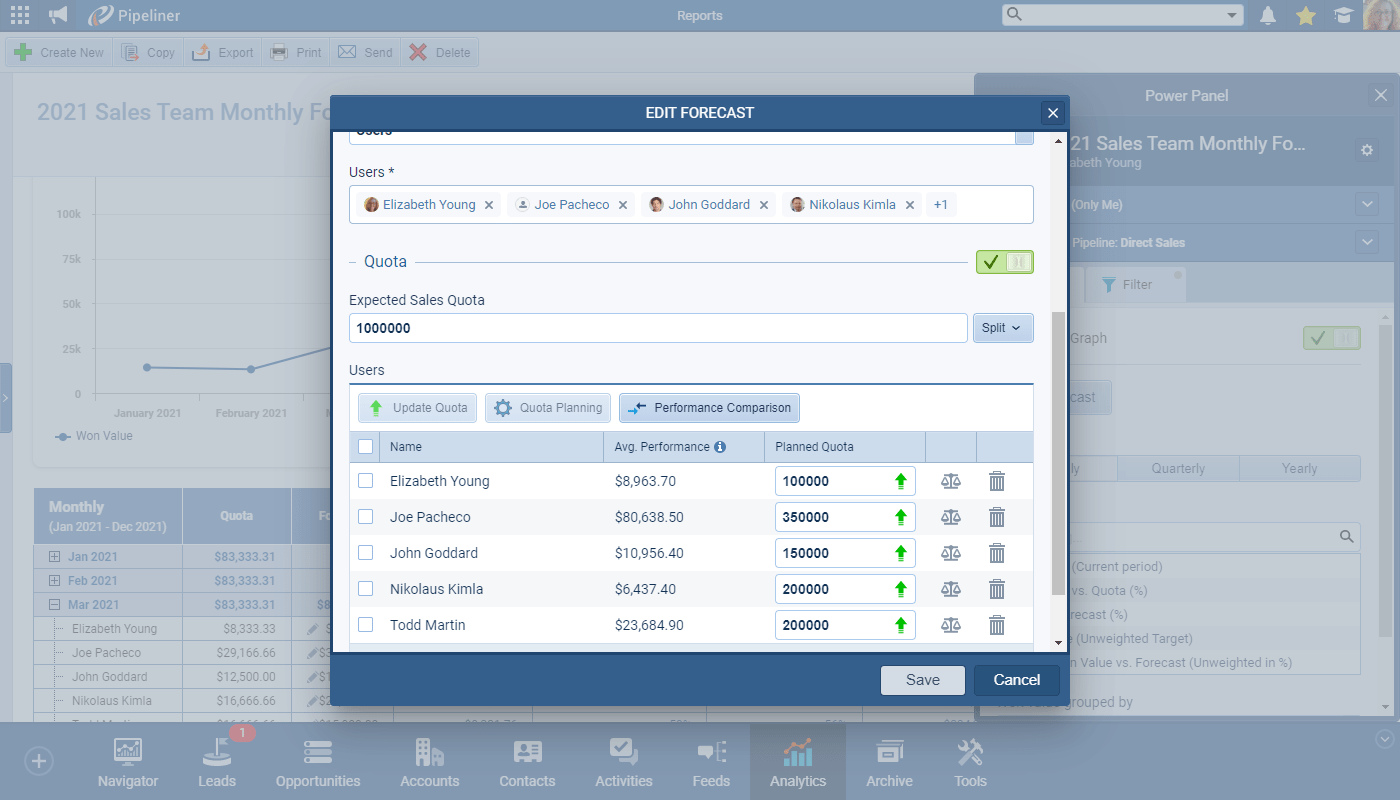
When creating a Forecast Report you can now choose to add a QuotaQuota Quota is a predefined benchmark indicating the amount of sales a selling unit such as a sales rep or a regional sales team should achieve within a given period, often used as a measure of success, performance and eligibility for commissions and other rewards. and can split the total between your selected users or units evenly, based on prior performance or type it in manually. You can also add in a Performance Comparison based on the previous period or average performance, for example.
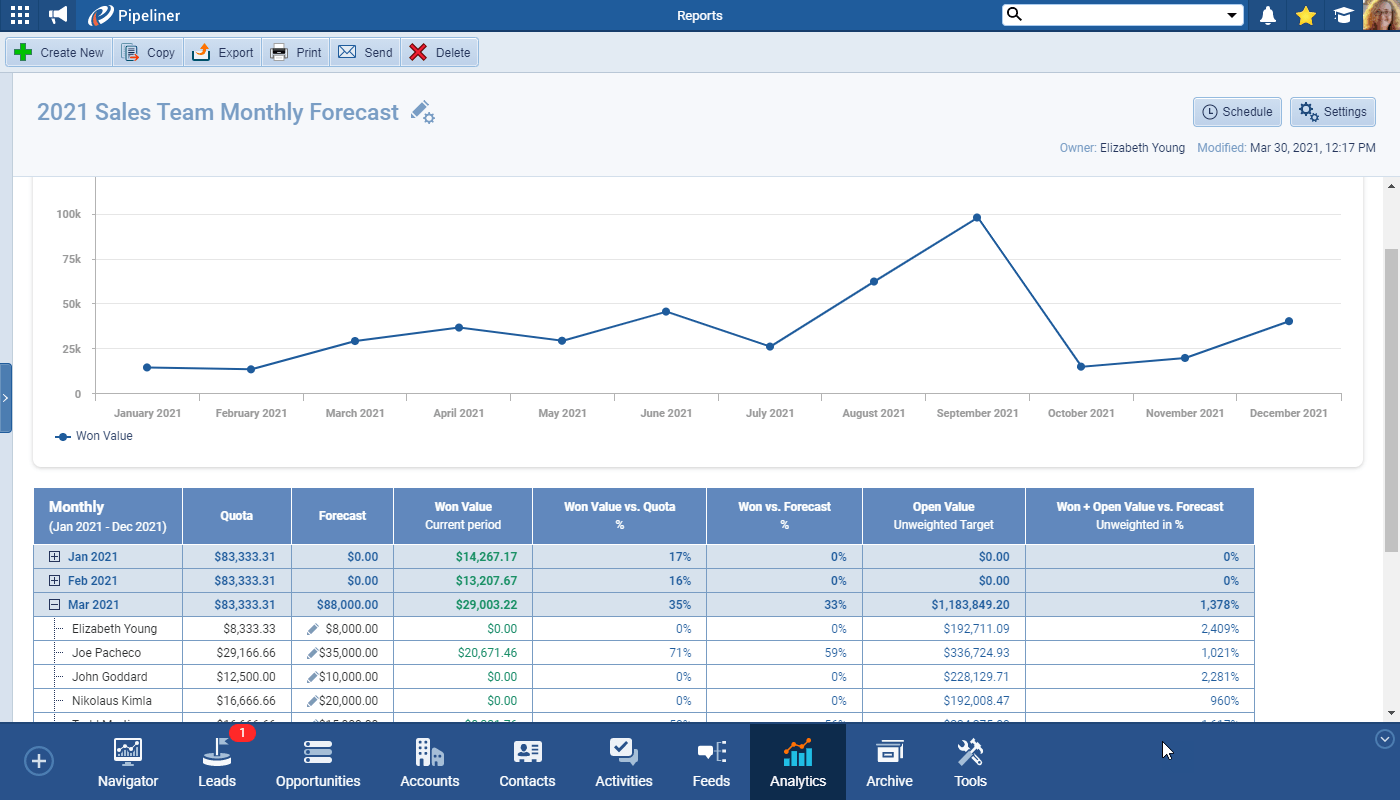
Your report can then show how your users are performing vs their Quota as well as against their Forecast.
You can select from a range of options including:
- Set Quota period — Monthly, Quarterly, Yearly
- Set Quotas by Sales Unit or UserUser User means a person who uses or consumes a product or a service, usually a digital device or an online service.
- Quota Options
- You have several options to choose from when it comes to setting the quota
- Custom › define the quota for each user or unit manually
- Evenly › Based on the value you enter for Expected Quota, Pipeliner will split the quota evenly among your users or units
- Historical Performance › Based on the historical sales performance of your users or units
- Update Quota
- In Quota settings, you can Update Quotas in one go. For example, you can calculate quotas based on historical performance and then increase the Quota by 10% for this year
- You have several options to choose from when it comes to setting the quota
- New Forecast Graph helps you to visualize how well your team is performing against the Expected Quota
Record Preview in Compact view, Tooltips and Sidebars
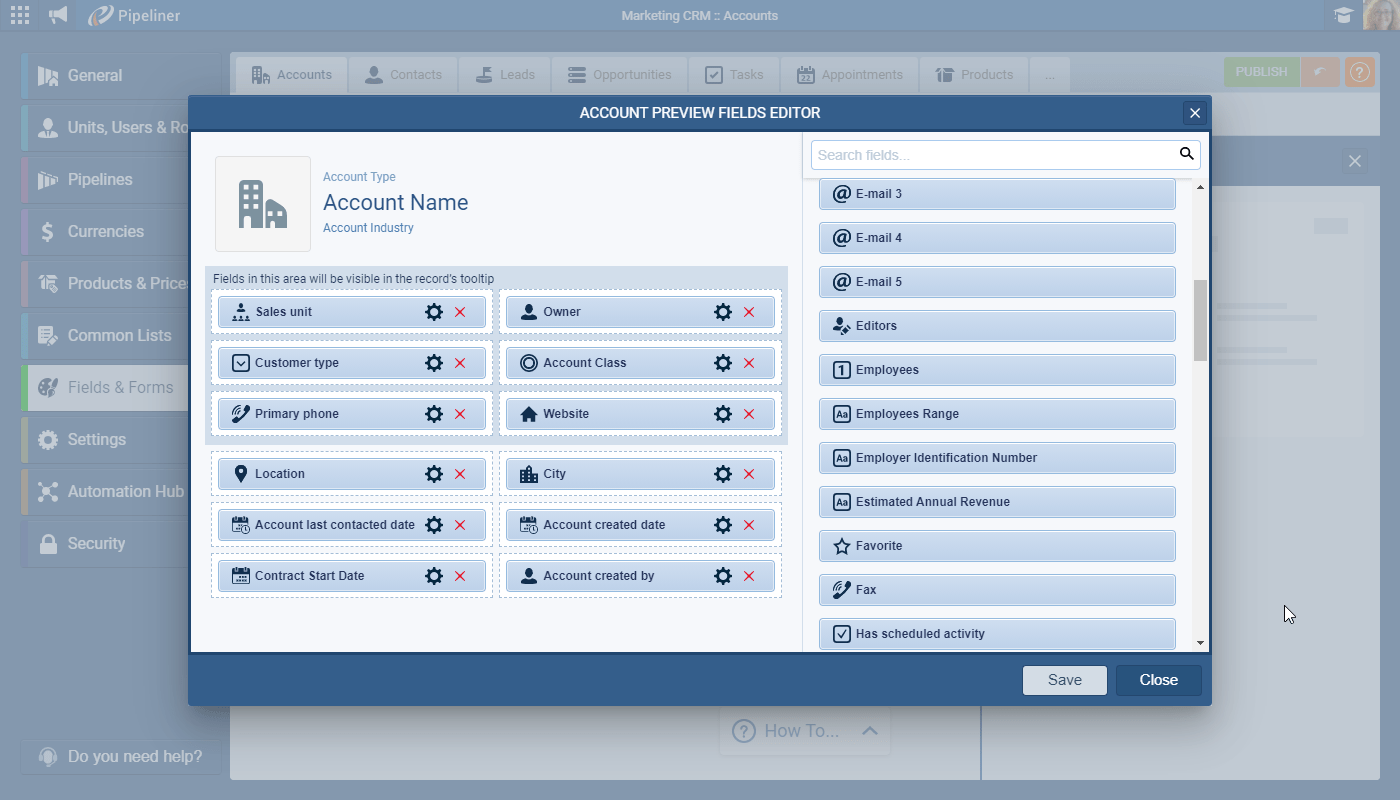
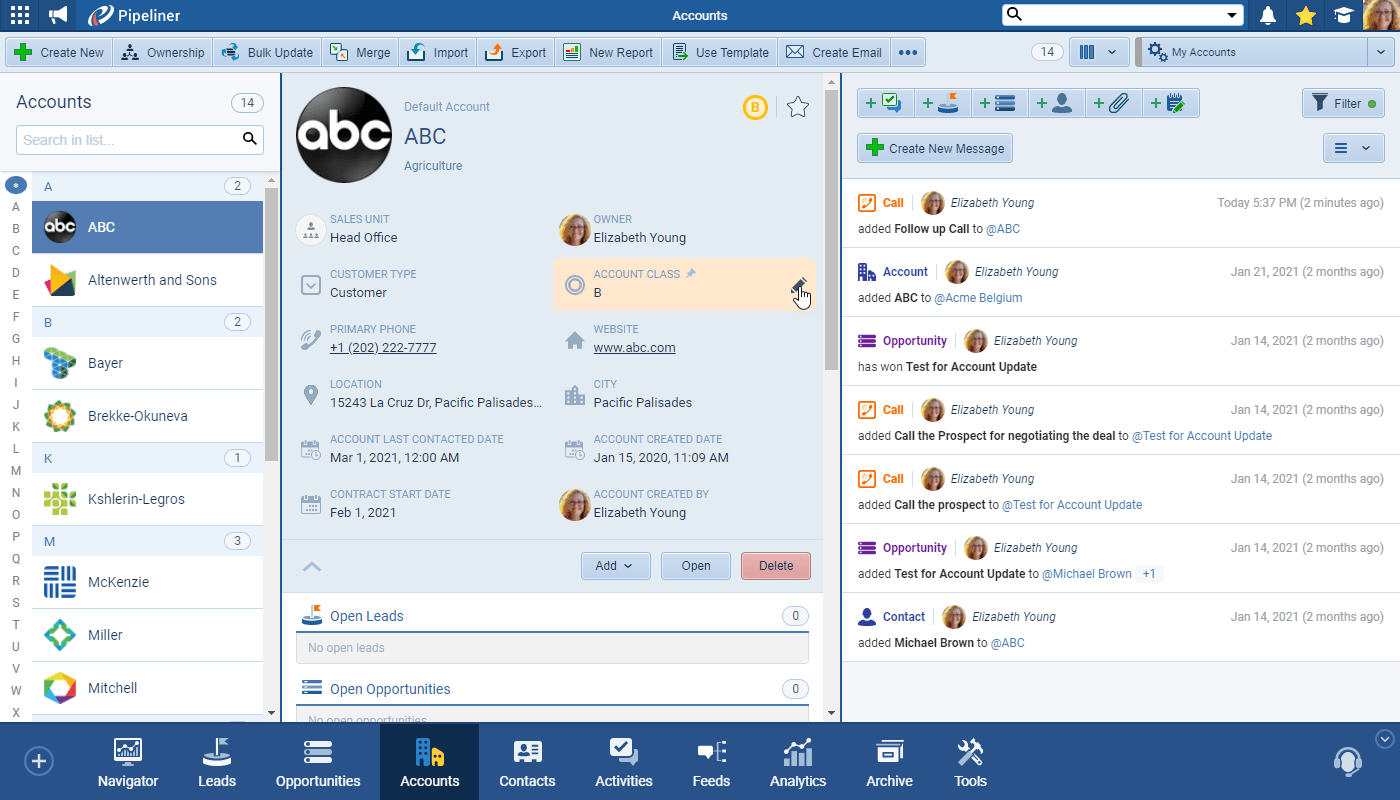
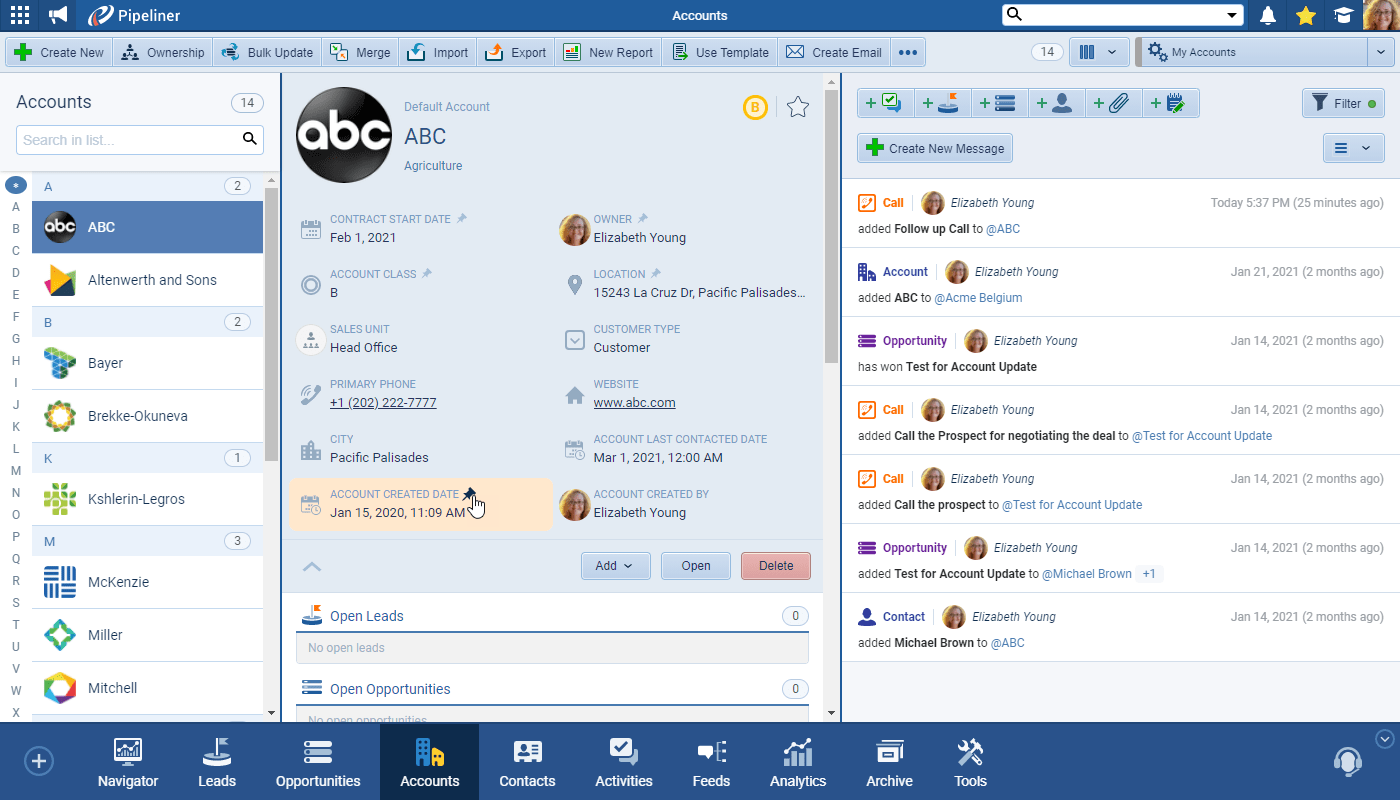
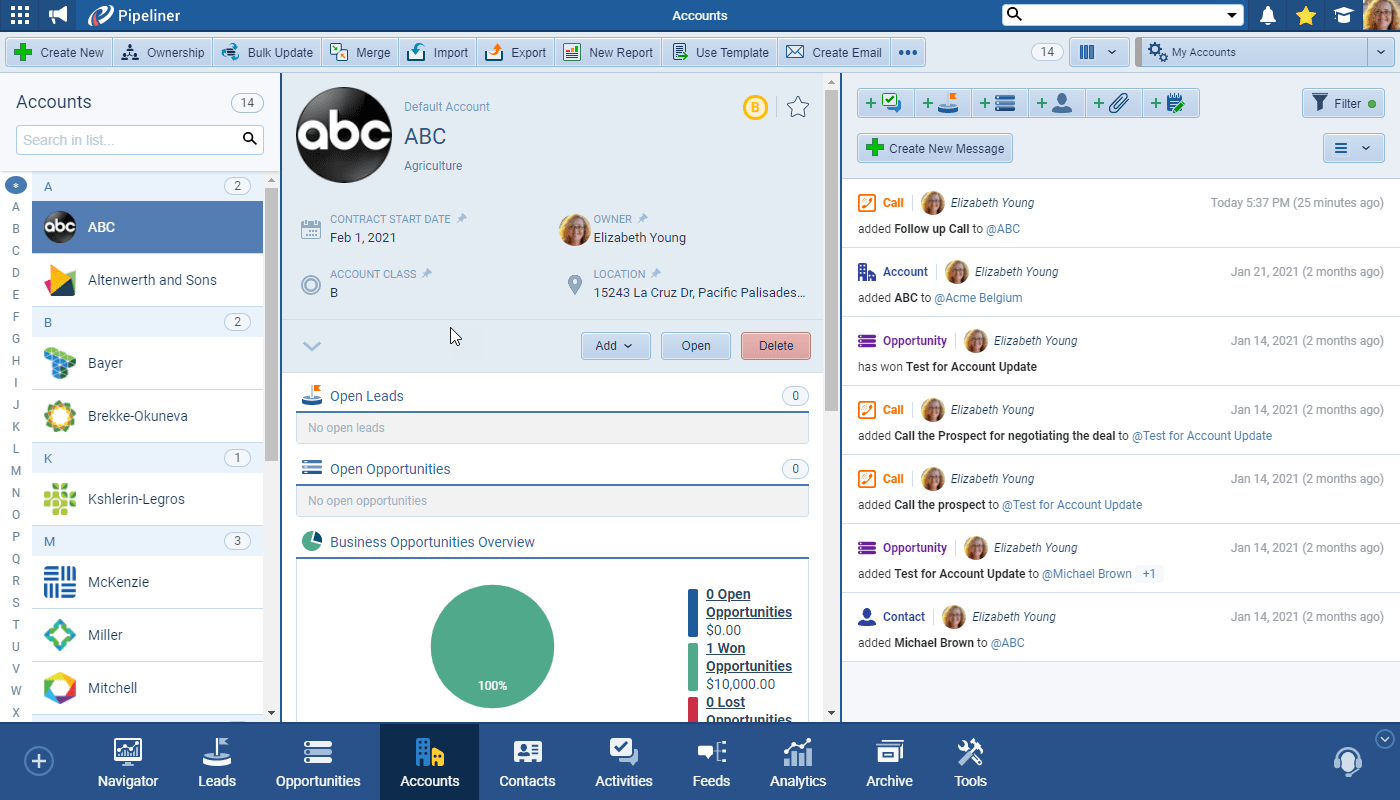
Your Pipeliner Admin can choose a maximum of 12 fields to include in the new Interface Tab in Fields & Forms. These 12 fields can include both system and user-defined fields.
Users will then see — and in most cases be able to inline edit — those fields in the Preview Panel or Sidebar. In QuickViews (Tooltips), the top 6 selected fields will display. Individual users can also choose to “pin to the top” just their own preferred fields from those selected by the Admin and then close the full view and only see their selected fields.
As part of our ongoing useability enhancement program, we’ve updated the following features.
Various Improvements
- A new field “Velocity” on Opportunities — Every Opportunity now has information about its total velocity. This is the total number of days that it took to Win or Lose the Opportunity from its creation. This is useful information when you are analyzing your PipelinePipeline Sales pipelineis a visual representation of the stage prospects are in the sales process. in our new Performance tab in Insights.
- Report Scheduling — We’ve added a new option to not send a scheduled report when the report doesn’t contain any dataData Data is a set of quantitative and qualitative facts that can be used as reference or inputs for computations, analyses, descriptions, predictions, reasoning and planning..
- Indicators Sum + Avg. — In Indicators, you can immediately see the total number of records included (sum) or the average number for each Indicator.
- Google forms can now also update data after submitting the form — Previously, the Google Forms integration could only create new Activities, for example. Now you can use it to update existing records as well.
- Reports improvement to filtering — When using Reports, you can filter by Related records not only the Primary.
- Feed speed improvements — Our ongoing program of speed improvements has focussed on Feeds to this release. We’ve seen improvements in the range of 40% for some datasets.
Pipeliner CRM Mobile Apps
We are also constantly improving our Mobile Apps you can check here.
Taking Multiple photos in Mobile Apps
In the Pipeliner Mobile App, users can attach photos by clicking “Take Photo” on Detail of record or in Global Action “Create New”. From there you can add multiple photos at once by clicking “Add Photo”. If you are not sure about a photo’s quality, you can also preview photos by clicking on “Preview”.
Release Notes
Pipeliner CRM is getting better and better with each new release. If you´re curious, what other releases we had, please visit our “Release Notes” section.
Theory Made Real
Based on proven economic principles, Pipeliner CRM is a tool for everyone.

