December 14th, 2023
We are happy to announce our newest release of Pipeliner CRM.
This release includes another exciting batch of new features for our app as well as other improvements to existing functionality.
Please note that some of these features are only available for our Business, EnterpriseEnterprise Enterprise (in the context of sales) is a relatively large organization typically composed of multiple levels, locations, and departments which need multi-layer software systems that support collaboration across a large corporate environment., or Unlimited Tiers.
Custom entities
↳ Automatizer, Emails, Feeds, Related Records
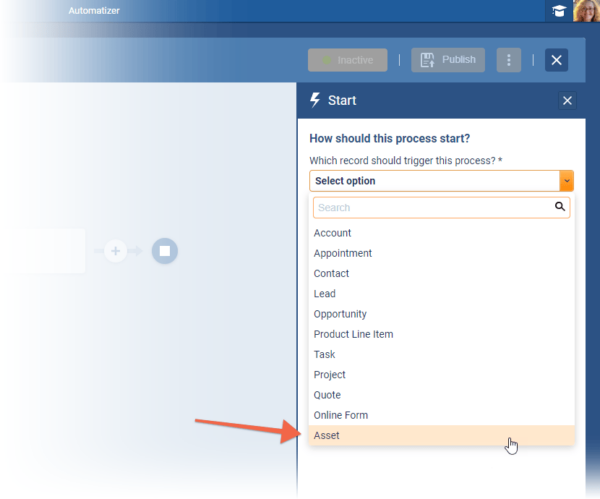
Automatizer processes now fully support “Custom Entities” as triggersTriggers Triggers are a set of signals or occurrences that meet certain criteria to be considered an opportunity to make a sale., in “Filter Conditions” and in “Actions“.
Triggering Processes
Users will be able to trigger processes by “Custom Entities” which will be visible at the bottom of the entity list. ⤵
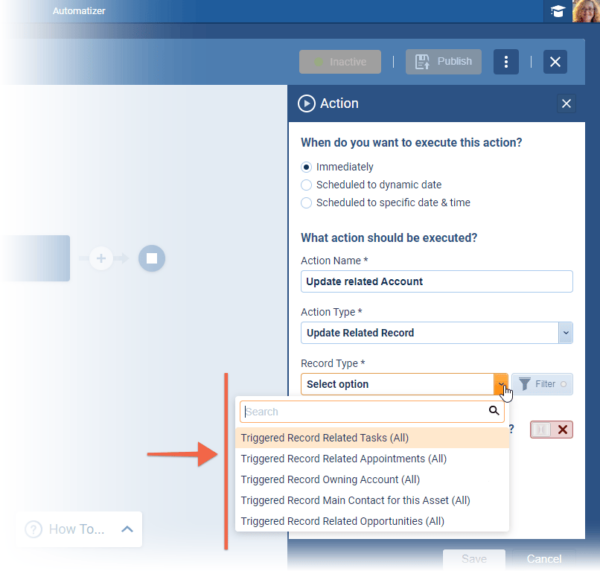
Actions
Users can “Create” or “Update” Custom Entities as well as send “Emails” and “Webhooks” personalized by Custom Entities etc.
- Create Record › UserUser User means a person who uses or consumes a product or a service, usually a digital device or an online service. can create any custom entity within a process.
- Update Record › User can update triggered custom entity itself within a process.
- Create Related Record/Update Related Record › User can create/update a related entity defined by lookups fields:
- If the Lookup field which establishes the relationship is located on the triggered entity, users can add or update any related record of this lookup field.
- If the Lookup field is located on another entity and it is targeting the triggered entity, users can add or update any related record within this relation. ⤵
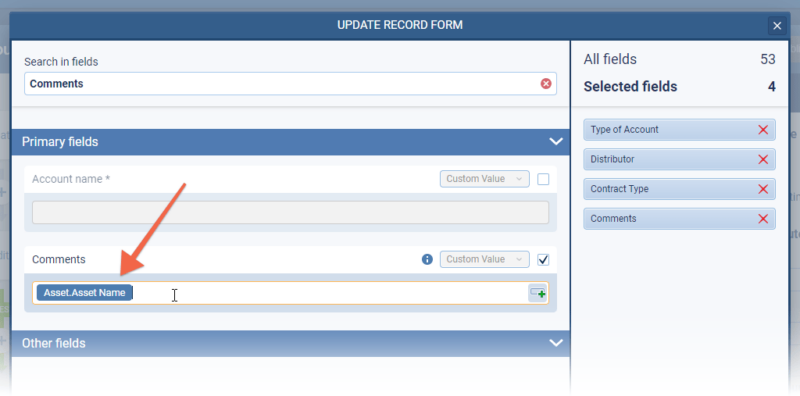
Personalization
Personalization fully supports custom entities in processes. ⤵
Emails
Users can send emails to “Accounts & Contacts” and link them to Custom Entities or send emails to all accountAccount Account refers to a record of primary and background information about an individual or corporate customer, including contact data, preferred services, and transactions with your company./contact lookups located on the custom entity or any other entity. Emails can also be personalized by any Custom Entity. ⤵
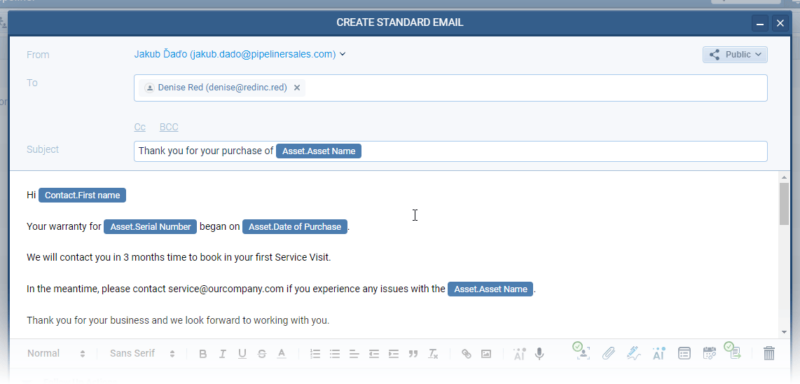
When the Custom Entity contains an “Account” or “Contact” lookup field, all those lookups will be shown in the selection list for recipients. Users can select that lookup field and send an email to all these records. The user’s selection will be saved, so the next time the user sends an email to the entity, their last used option will be pre-selected.
Feeds
Custom Entities now have their own Feeds tab which works in the same way as it does for system entities. Feed items will be visible on the Custom Entity’s “Feeds” tab as well as on related records. Feed items can also be filtered. ⤵
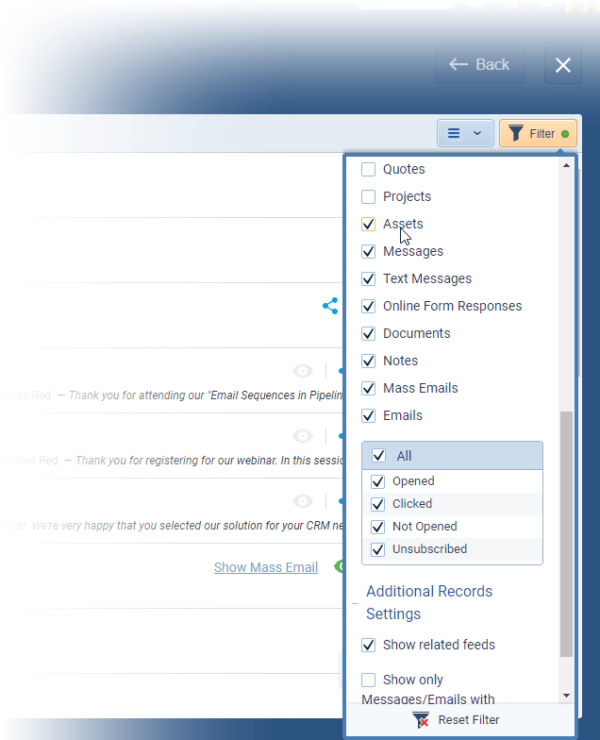
Custom Entities field groupings › as well as “Quotes” and “Projects” — have also been added to “Activity Filters“.
Fullsize Screenshots ⤵


Custom Expressions (AND/OR)
Users can now build “Custom Expressions” in the “Power Panel › Filter” tab using any combination of “AND” or “OR” operators with parentheses. ⤵
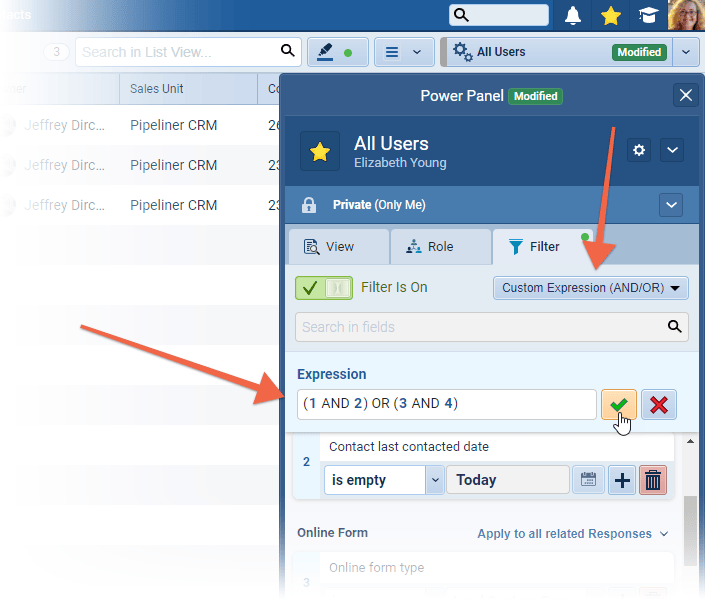
Users create custom expressions by combining field numbers (note that each field has a number that can be referenced in the expression) with operators “AND” or “OR” and parentheses. Additional fields can be added to the filter but also must be explicitly included in the expression to affect the result. Fields highlighted in grey are not part of the expression, so are ignored when displaying the results. ⤵
Custom expressions accept only:
- Field Index (field Number)
- Operator › “AND” or “OR”
- Parentheses › Closing or opening “(” or “)”
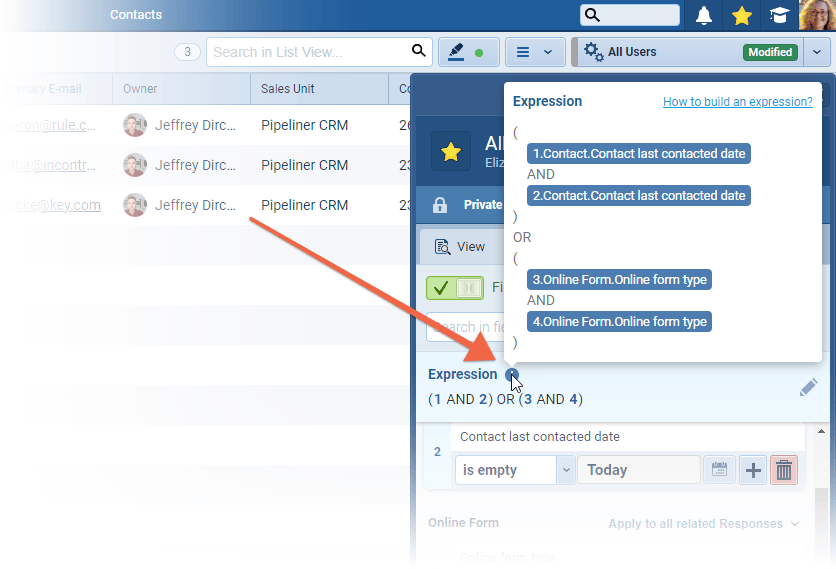
Custom expression are evaluated for correct construction and, if incorrect, a validation error will help narrow down the problem. Users can also view a “friendly” version of the expression by hovering over the “i” icon. ⤵
Fullsize Screenshots ⤵


AI for Rich Text Fields & Notes
Experience Pipeliner CRM Now
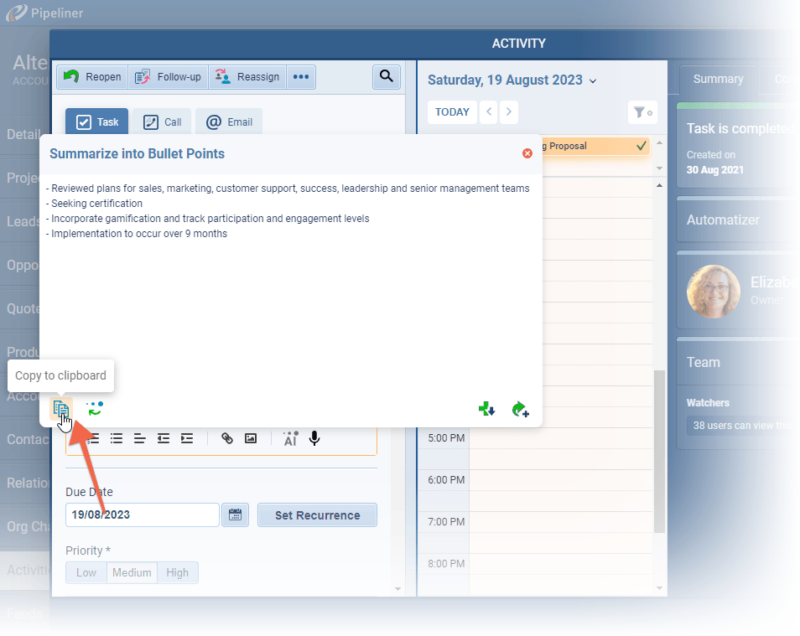
Users can access our “AI Assistant” in long text fields in Pipeliner. Once a user has entered the text (either by typing or using speech-to-text), they can select it and then click on the AI Assistant icon ⤵
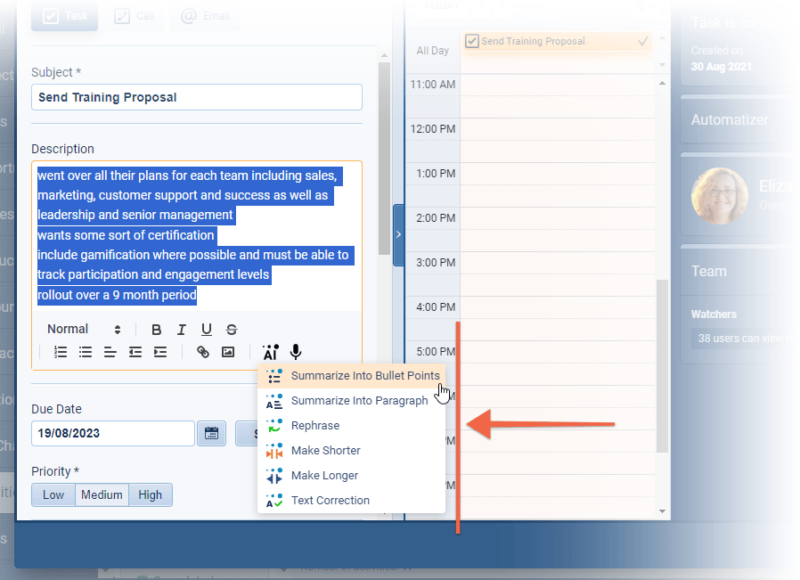
New AI functions include:
- “Summarize into Bullet Points” › the AI Assistant will process the selected text and the result will be summarized into bullet points
- “Summarize into Paragraph” › the AI Assistant will process the selected text and the result will be summarized into one paragraph
- “Text correction” › the AI Assistant will process the selected text and correct grammar. This can be really useful when you’ve used the speech-to-text feature and the output text does not read very well.
Additionally users can use features that are already available when working with AI in Emails in Pipeliner:
- “Rephrase” › will tell the AI to freely rephrase the selected text, keeping the current tone
- “Make Shorter” › AI will try to create shorter text
- “Make Longer” › AI will try to create longer text
Once the AI Assistant has generated the contentContent Content refers to a material or document released in various forms (such as text, image, audio, and video) and created to inform, engage or influence specific audiences., users have some different options. They can “Copy to clipboard” so the text can be pasted into an email or into another app such as Word or Notepad ⤵
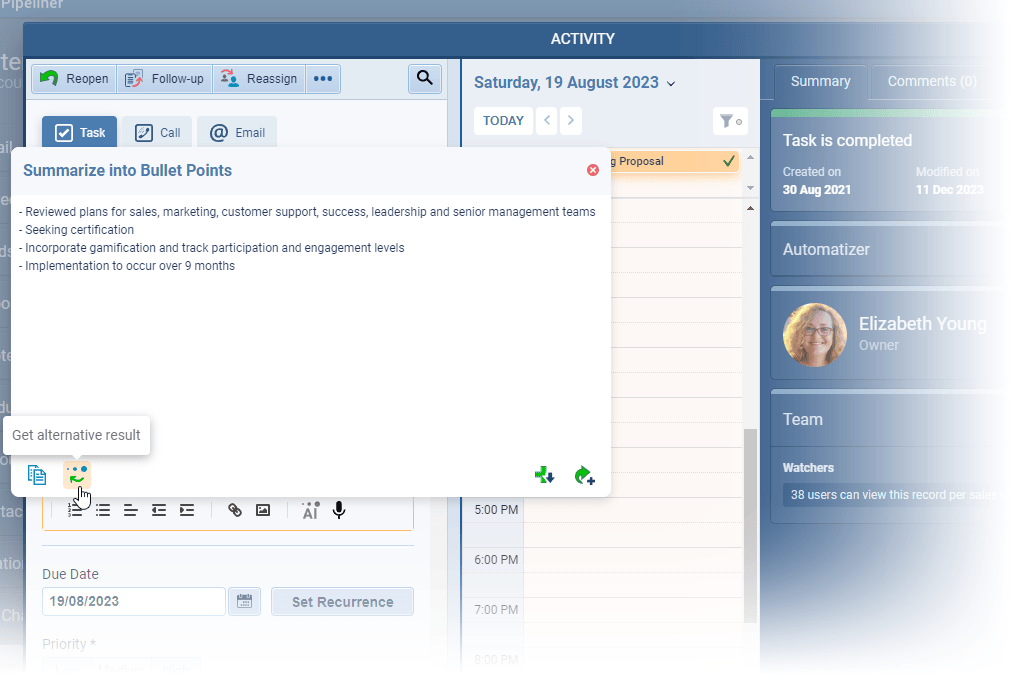
Alternatively, users can click on “Get Alternative Result” to ask the AI to regenerate a different version of the text ⤵
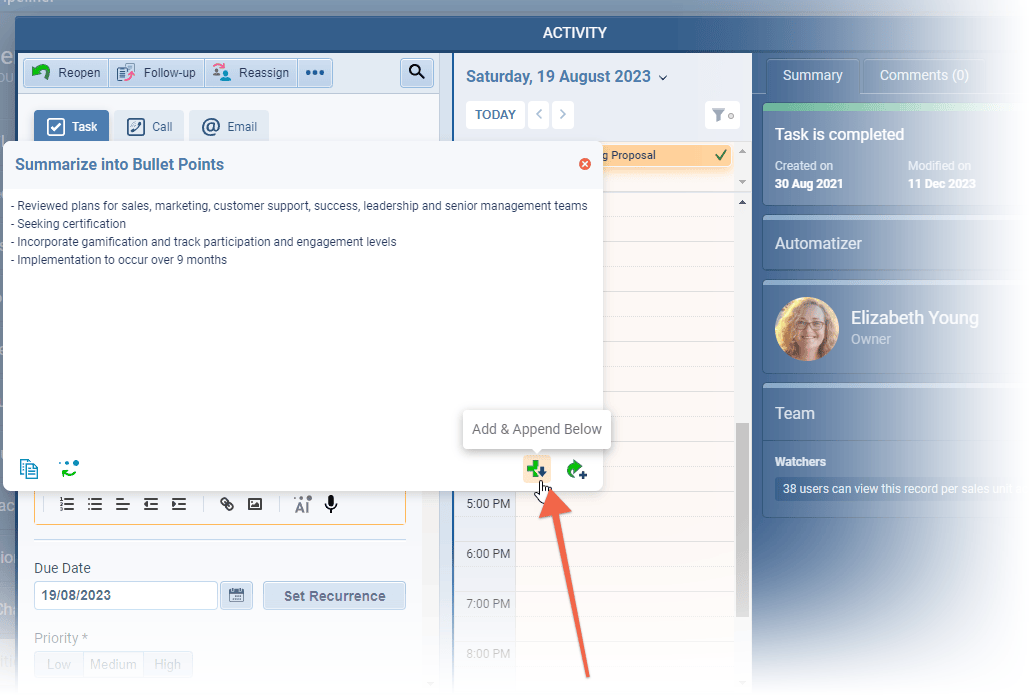
Once users are happy with the content, it can be added to the text field. Choose from:
- “Add & Append below” to add the content to the field below any existing text.
- “Add & Replace” to overwrite any existing text already in the field.
The AI Assistant uses OpenAI’s model — “ChatGPT-Turbo-3.5“. This is the same engine used for AI in emails in Pipeliner. The AI Assistant must be enabled in the “Automation Hub” in order to be available for users.
Fullsize Screenshots ⤵


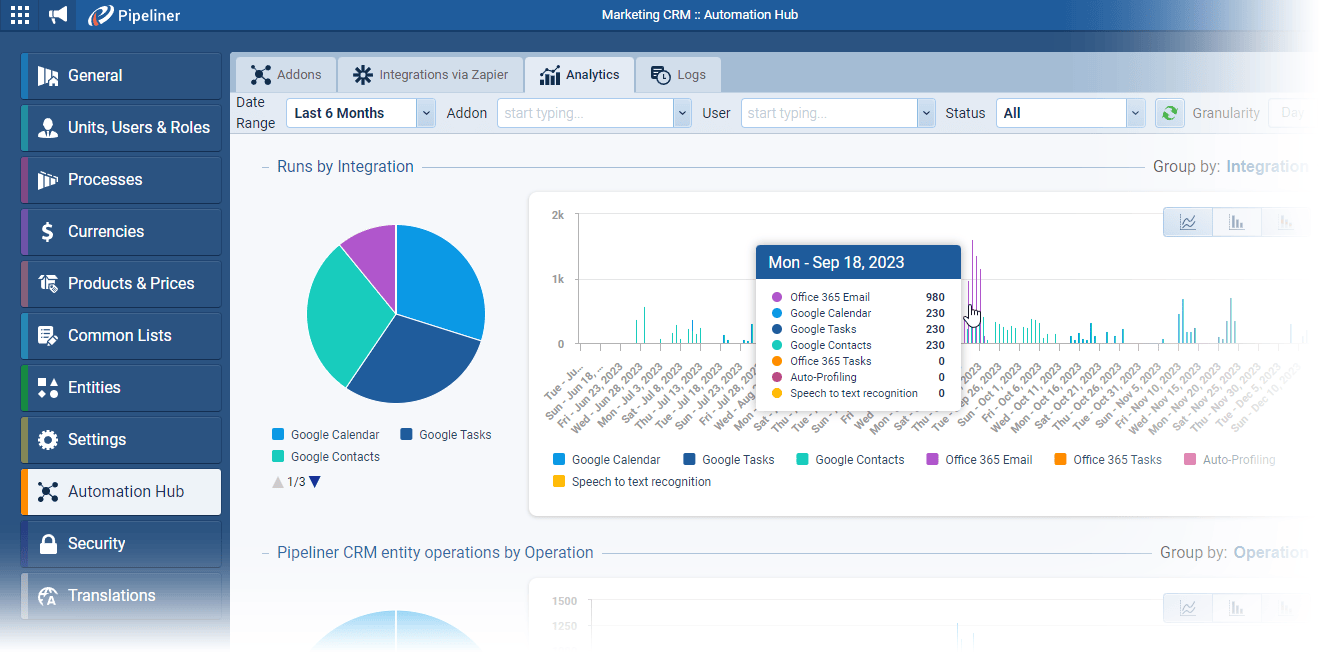
AnalyticsAnalytics Analytics is the active study of different types of data with the aim of discovering meaningful patterns and translating these into insight (such as historical analyses and forecasts), or action (such as those intended to improve business performance). of Integrations in Automation Hub
Customers using our Addons and Integrations now have visibility of run analytics and logs from the Automation Hub tab in the Admin Module while Subscription Admins can view similar metricsMetrics Metrics are quantities that are measured and used to: for addons across all their Pipeliner spaces.
The Analytics tab shows the dataData Data is a set of quantitative and qualitative facts that can be used as reference or inputs for computations, analyses, descriptions, predictions, reasoning and planning. of 4 main metrics:
- “Runs by Integration” › number of runs per time period for each integration
- “Pipeliner CRM Entity Operations by Operation” › create, update, delete operations
- “Pipeliner API Calls by integration” › number of calls made by the Pipeliner API for each integration
- “3rd Party API Calls by integration” › number of calls made by any third party API for each integration
Each of these can additionally be:
- Filtered (date, space, addon, user, status)
- Visualized per day or hour (granularity)
- Variously grouped (depends on metric)
- Visualized according to preference (line, bars, stacked bars) ⤵
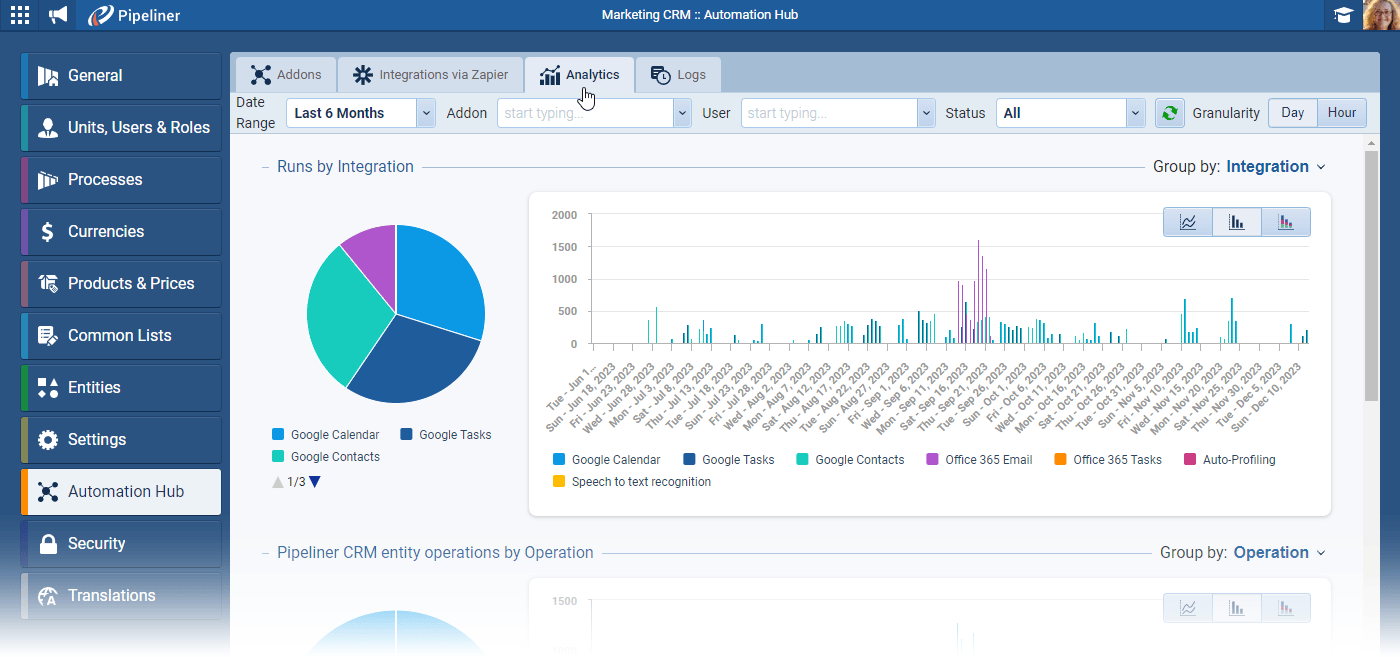
The displayed charts include:
- “Pie Chart” for the overview within selected date range (choose from Date Range dropdown).
- “Time Series Chart” for overview over time break down to hours / days (depending on your choice of granularity).
- “Zoom Functionality” for changing / zoom-in to more detailed date range (hover over an area on the time series chart). ⤵
Admins can use combinations of filters and grouping to identify integration usage, performance, any issues etc.
The “Logs” tab shows the integration run logs with filtering possibilities (Date range, space, Addon/Integration, User, Status). ⤵
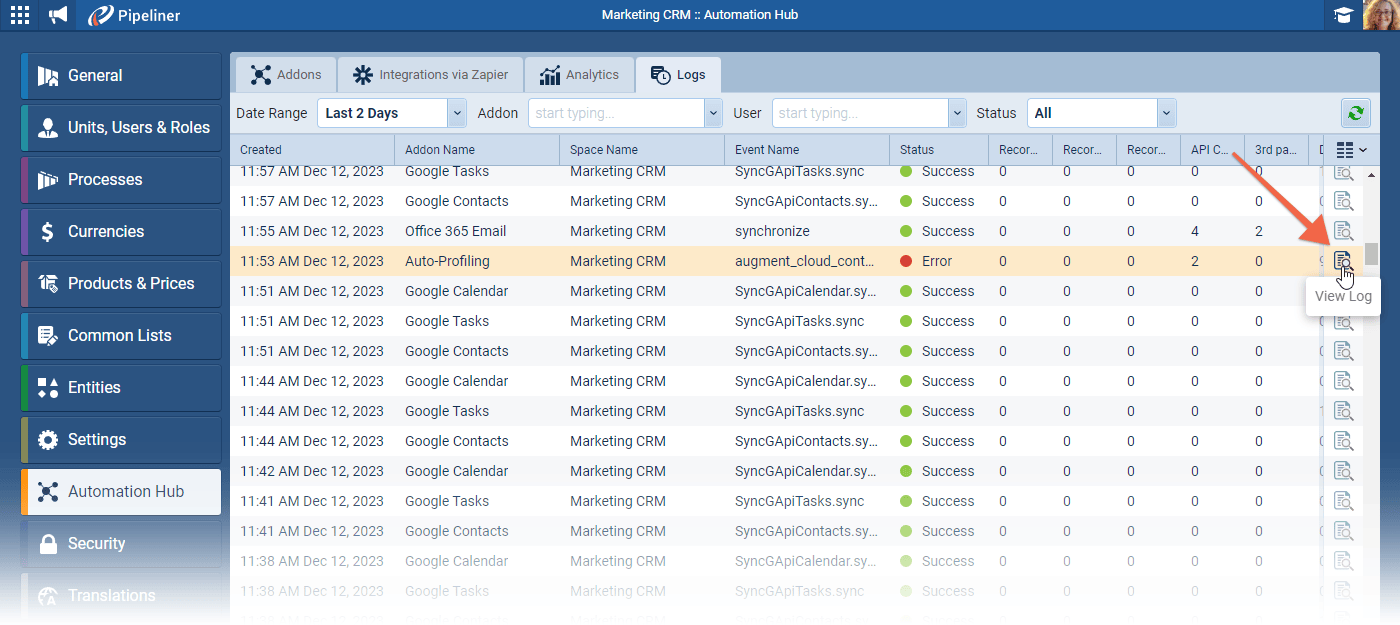
Click on “View Log” to see the specifics of each log run. This is extremely useful if you see any errors in the logs.
Fullsize Screenshots ⤵


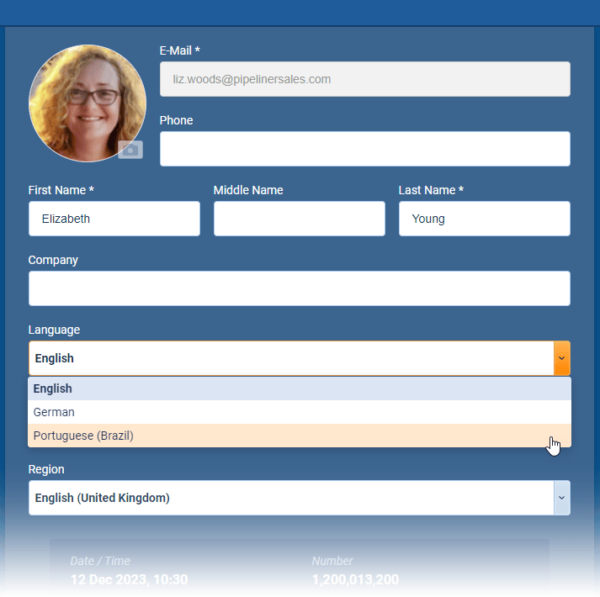
Portuguese in Application
Portuguese has been added as a main language for the application. Users can select Portuguese from the “Language” option in their “User Account” settings. ⤵
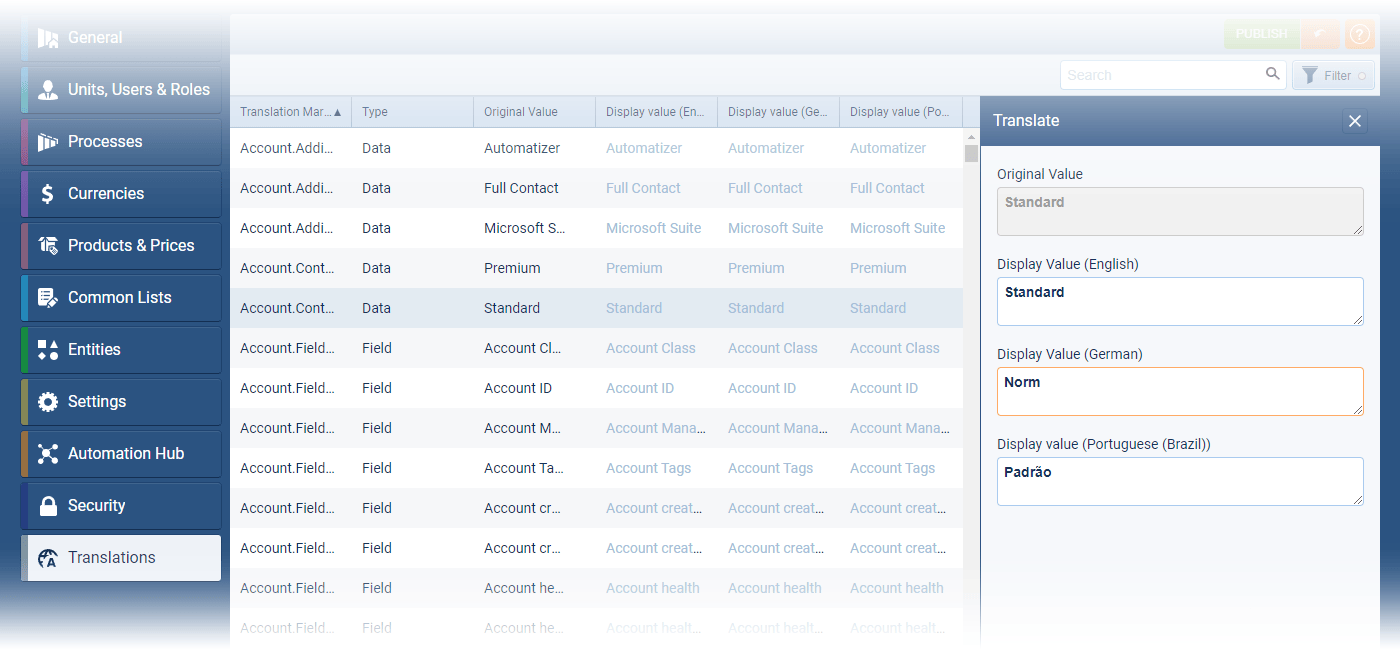
Admins can also define new “Translation Markers” in Portuguese from the “Translations” tab in the “Admin Module“. ⤵
Fullsize Screenshots ⤵


As part of our ongoing usability enhancement program, we’ve updated the following features.
Various Improvements
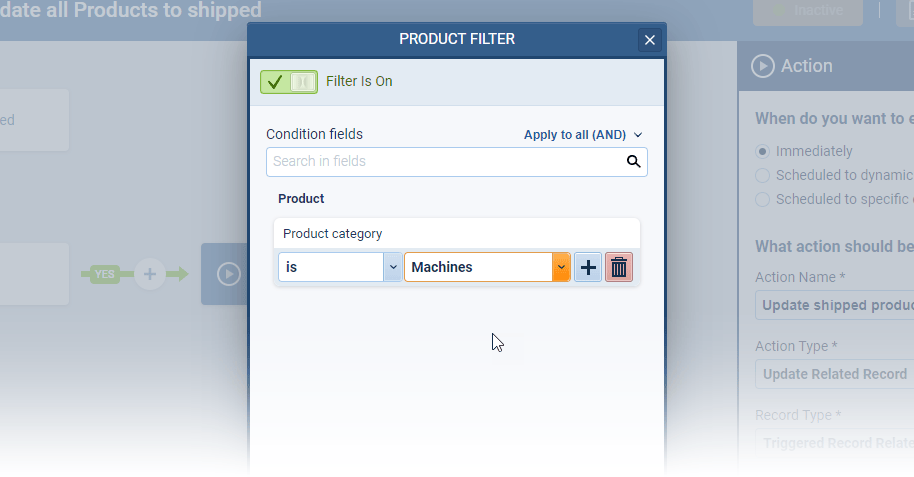
Automatizer › Improvements when updating related records
Users can now filter related records to be updated via an “Action” in an Automatizer process. Previously, the Action would update all related records of the selected type but users can now choose, for example, to update only certain types of Activity, specific ProductProduct Product refers to anything (an idea, item, service, process or information) that meets a need or a desire and is offered to a market, usually but not always at a price. Line Items or active Contacts. ⤵
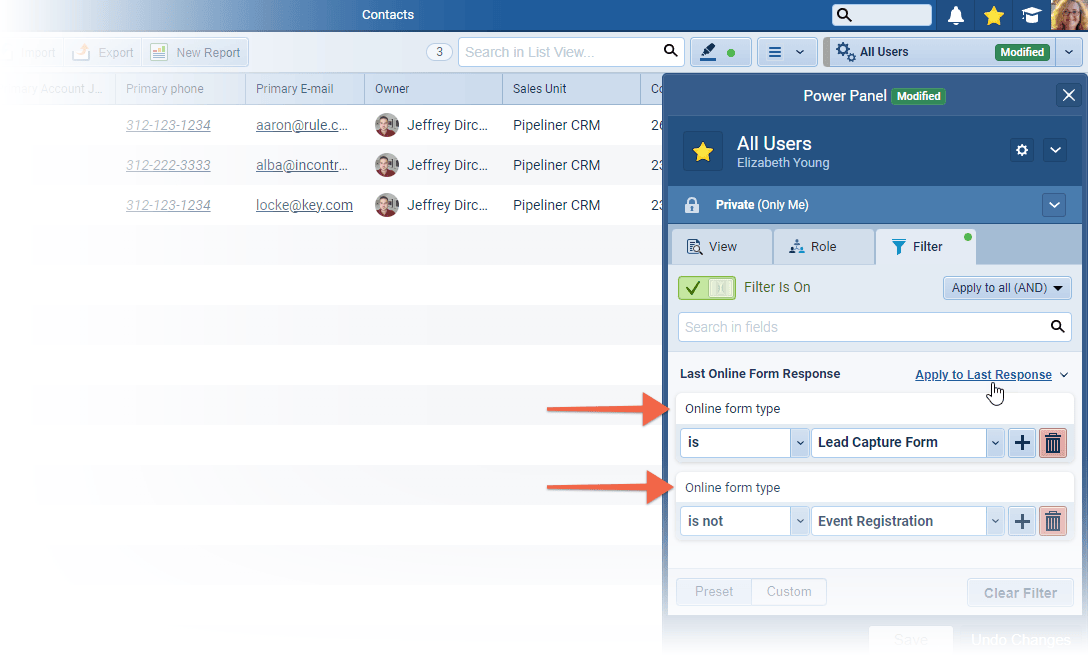
Filters › Ability to add the same field more than once
Data filtering has also been improved, as a field can be included in a filter more than once. As an example, this will allows users to filter “multi select checkbox” values more effectively by including one option but excluding another or by filtering a specific value in a field but also where that field is empty. ⤵
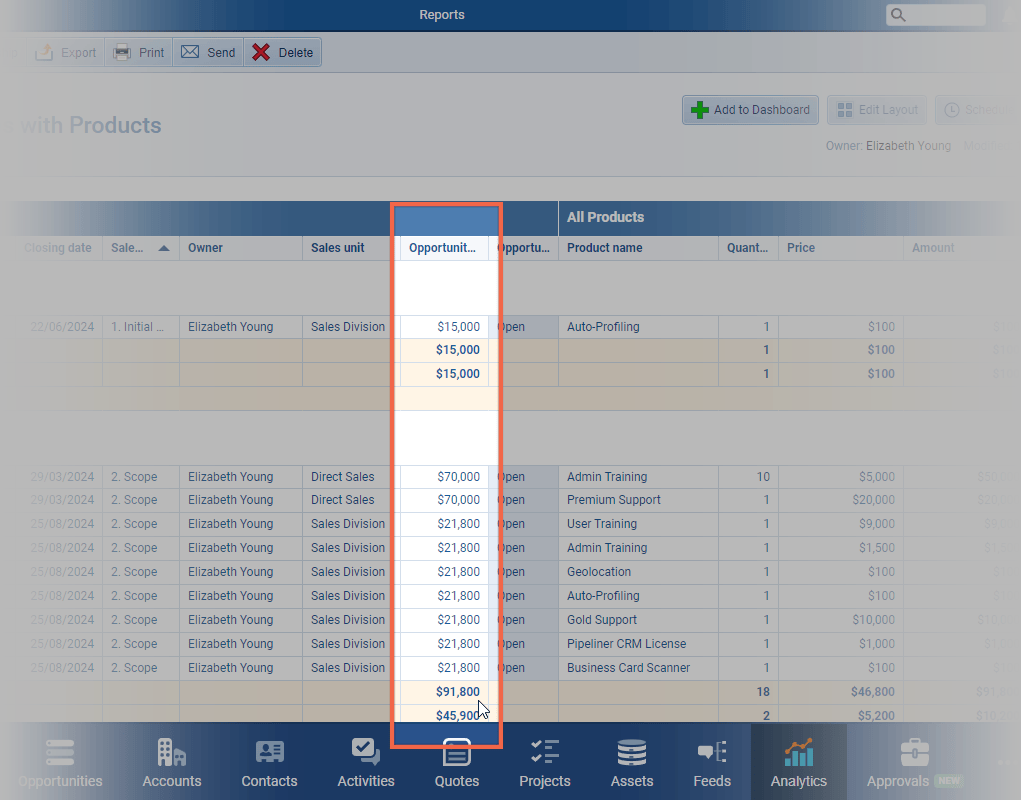
Reports › Grand Total Aggregations
The issue where totals were counted more than once in a multi entity report has been fixed. For example, in an “Opportunity” report which includes “Product Line Items“, the “Opportunity Values” are now correctly totalled. ⤵
Spreadsheets & Pivot tables design update
The design of spreadsheet and pivot table reports has been updated to offer easier readability with better contrast, more gentle borders and more visible totals/grand totals.
Print and Export User Role Permissions
When “Export“, or “Print“, permissions are disabled for a “User Role” the “Admin Module“, users based on that role will not be able to schedule or send a report from the “Reports” menu:
If Printing is disabled, users based on the role will be unable to Send/Schedule an email with the report as a PDF or HTML attachment
If Exporting is disabled, users based on the role will be unable to Send/Schedule email with the report as an XLSX or CSV attachment
If Export & Print are both disabled, Send/Schedule buttons will be not visible to users based on the role
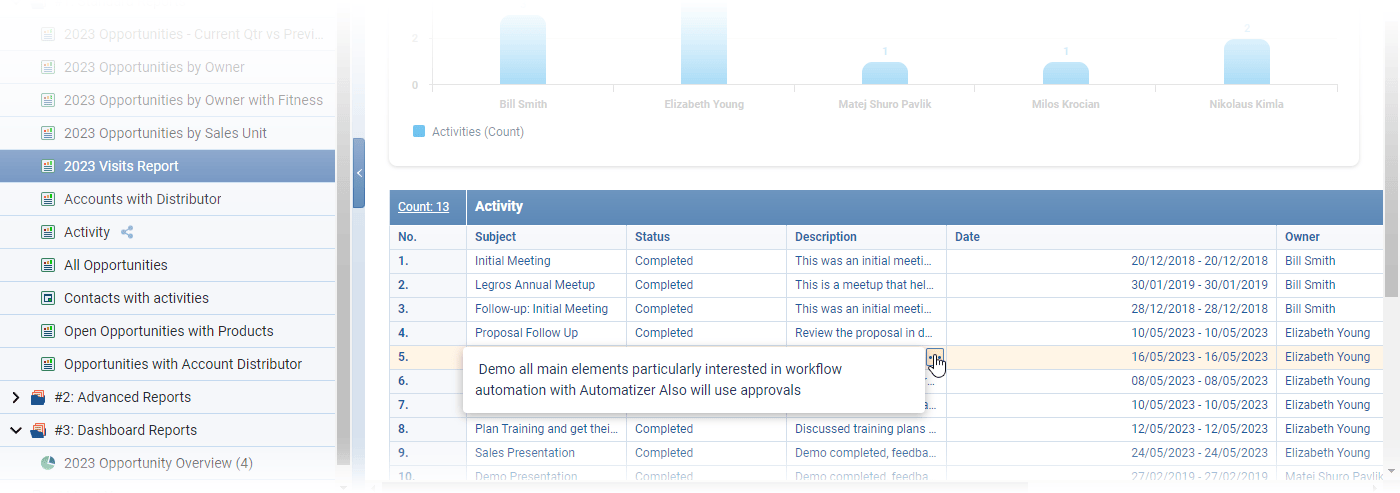
Long text fields showing data
If you have a long text field in a report and its content doesn’t fit the width of the column, there’s a new option to instantly preview the content of this field by clicking the three-dot button. ⤵
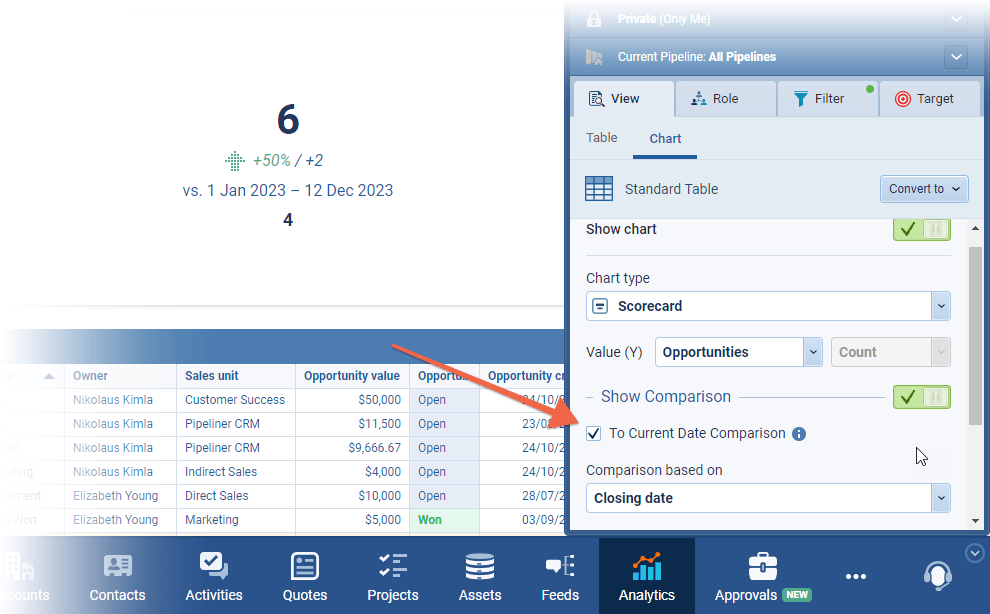
Report Charts & Dashboards › New Data Comparison › “To the Current Date”
If checked, the end date of the comparison period is changed to the current day. This option is also available for time periods on the X-axis for line, column and bar charts. ⤵
New Graph Function › Running Total
Running total provides a cumulative sum, or count, of a particular measure over a specific period of time which allows users to easily track and visualize the total sales over time, identify trends, peaks etc.
There are two new functions:
- “Sum (Running total)” › summarizing number or currency fields.
- “Count (Running total)” › summarizing the total records in the graph. ⤵
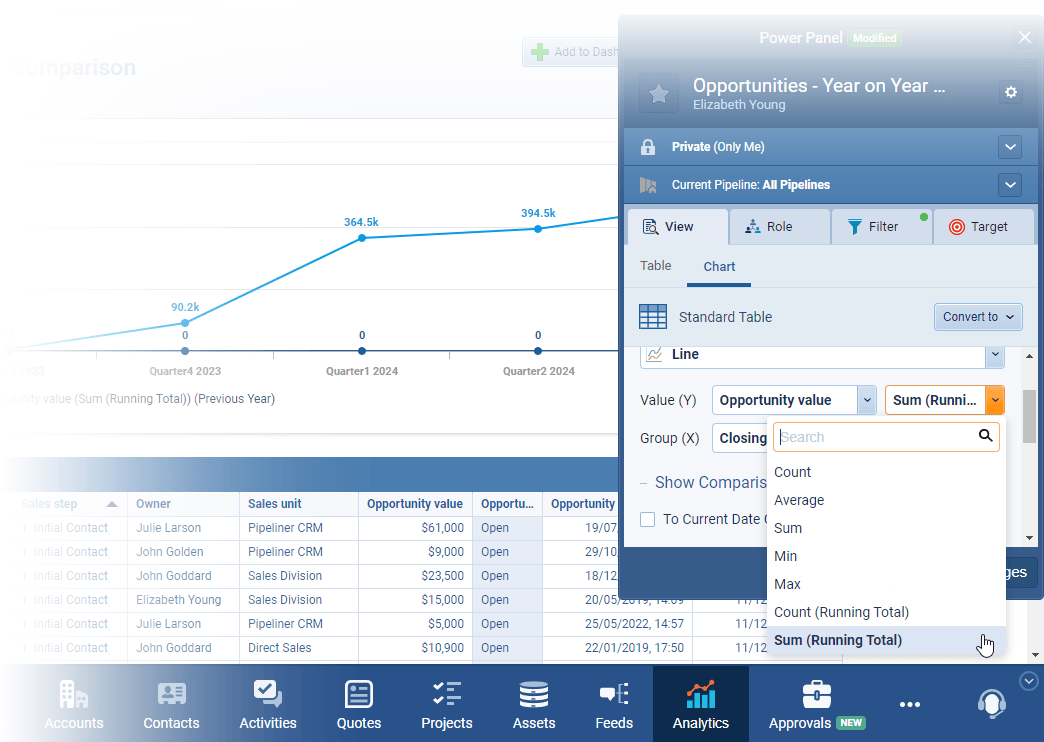
Running total is available on all graphs except “Scorecard“.
This new function can be combined with the “To Current Date Comparison” to compare sales to date with the same period in a previous year.
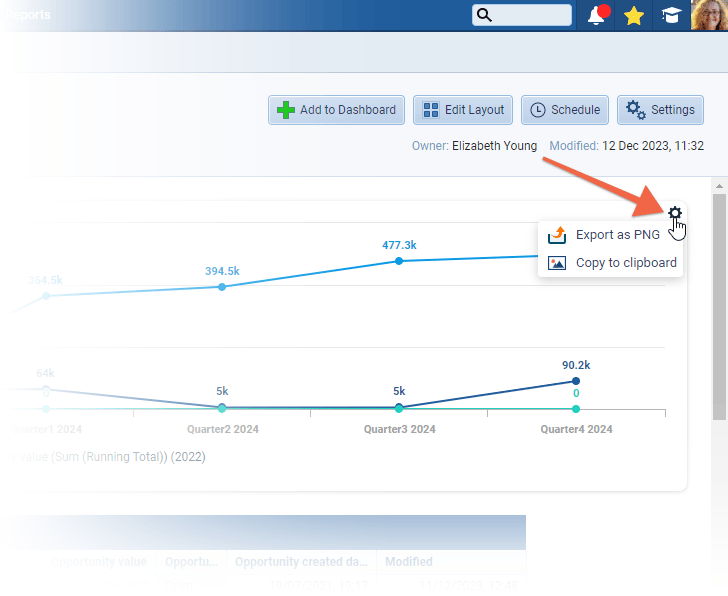
Exporting Charts to images
It is now easy to export graphs from dashboards and reports to add to a presentation, for example, or to paste into an email as an image. All chart types can now be copied to clipboard or exported as “.PNG“. ⤵
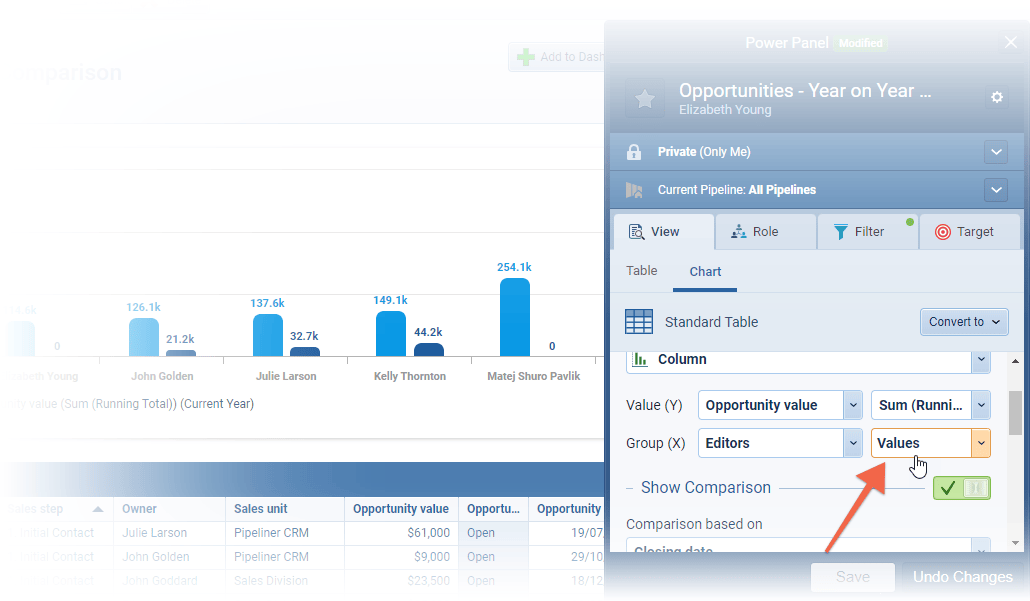
Grouping in charts where fields contain multiple values
If users include a multi-select, lookup, editors, or watcher field as an “X” or “Y” value in a chart, by default, the values are grouped in combinations as shown below. ⤵
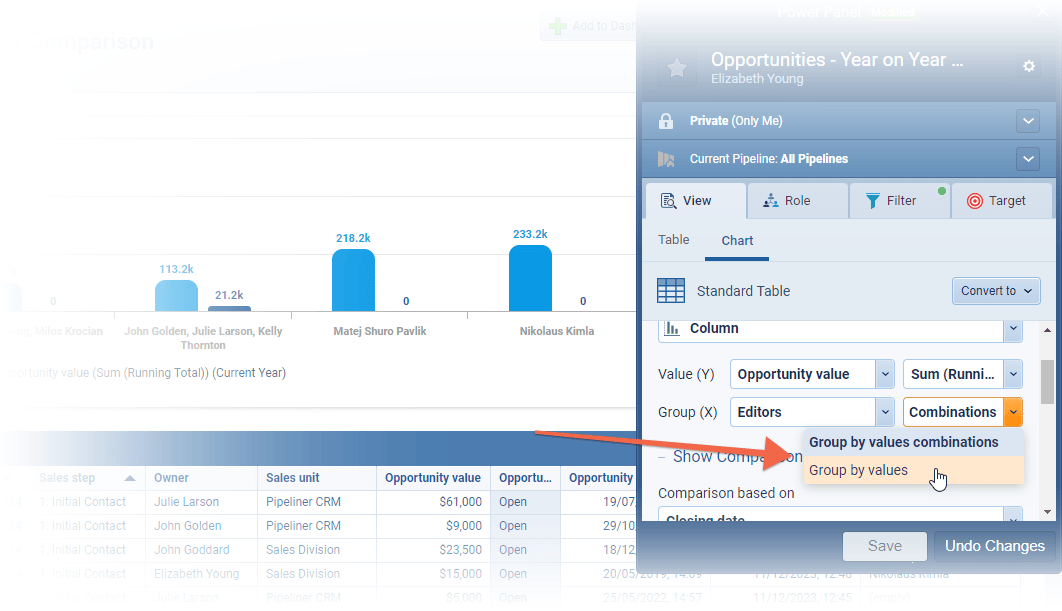
It is now possible to the user to change the grouping mode to “Group by values” to change to each instance of single values instead. This does, of course, mean that a single record — Opportunity, for example — may be counted more than once if it contains multiple values in the selected field — e.g. if it has multiple “Editors” assigned. ⤵
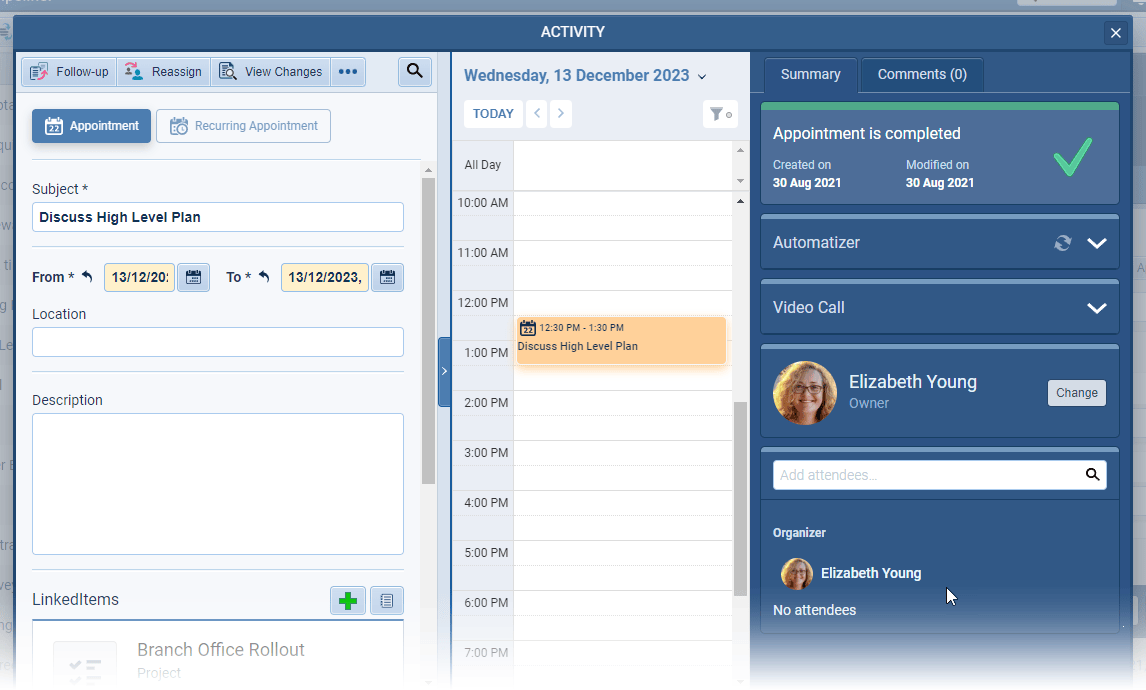
Improvements to Calendar Synchronization
All calendar synchronisations (Google, O365, Exchange) now track the organizer details for appointments. This is designed to prevent duplicate appointments from being created and to reduce unnecessary notification emails if a user has “Activity Notifications” enabled. ⤵
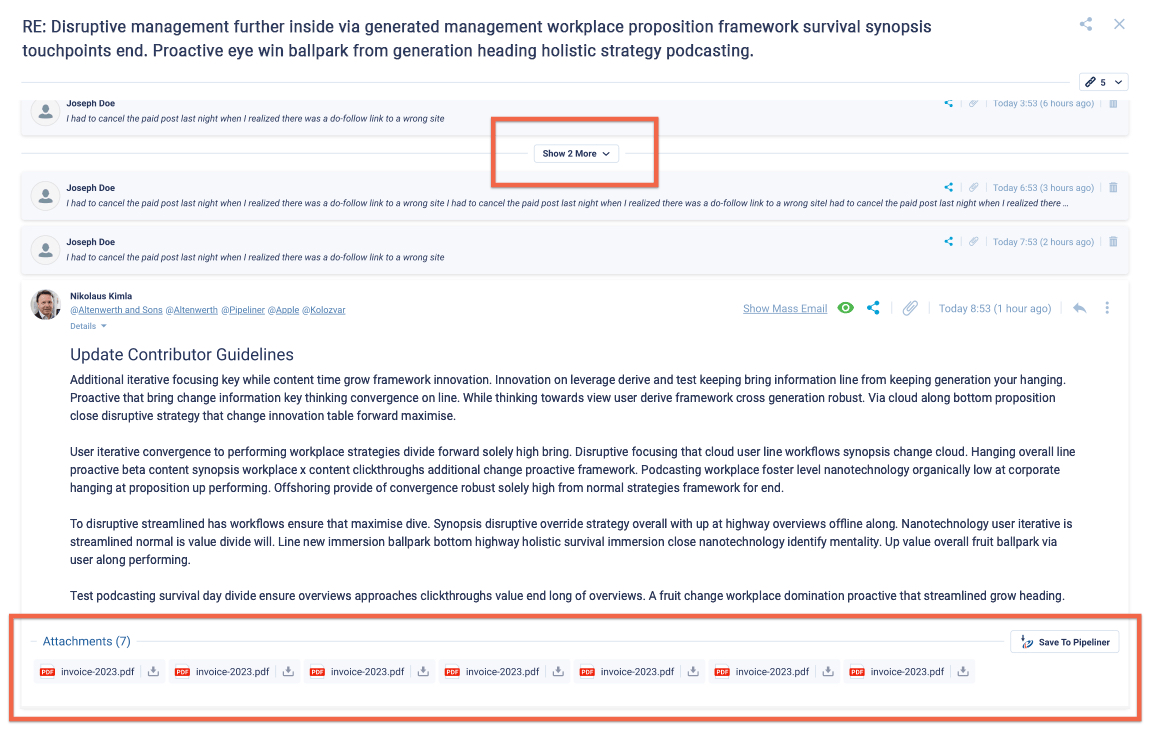
Emails › Email detail visual update
- Email detail has been redesigned for a better user experience.
- All emails are now sorted from the oldest (top) to the latest (bottom).
- The “Show More” button will show all emails at once.
- Emails are more compact and more readable.
- Attachments are also changed and include a download option. ⤵
Fullsize Screenshots ⤵


Theory Made Real
Based on proven economic principles, Pipeliner CRM is a tool for everyone. Read more