March 21st, 2024
We are happy to announce our newest release of Pipeliner CRM.
This release includes another exciting batch of new features for our app as well as other improvements to existing functionality.
Please note that some of these features are only available for our Business, EnterpriseEnterprise Enterprise (in the context of sales) is a relatively large organization typically composed of multiple levels, locations, and departments which need multi-layer software systems that support collaboration across a large corporate environment., or Unlimited Tiers.
History Reports
This release includes another major enhancement to our Report Engine. Users can now create a new type of report: “Report with Historical DataData Data is a set of quantitative and qualitative facts that can be used as reference or inputs for computations, analyses, descriptions, predictions, reasoning and planning.“. Creating these reports is fundamentally the same as any other type but they are designed to allow users to track changes made to values over a period of time using date comparisons or historical trends. Fields that are tracked in the “Change Log” (accessed via the “View Changes” button on an open record) can also be used to track historical data in a report.
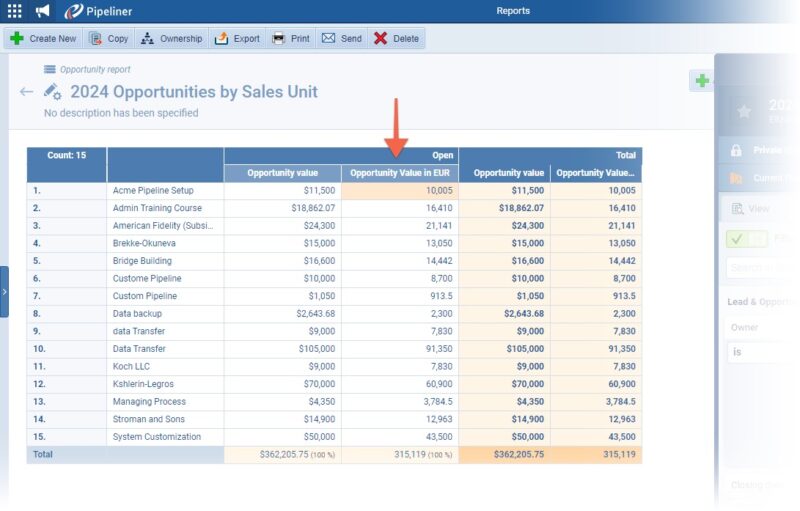
Use this type of report to answer such questions as “What’s the current value of our open opportunities as compared to their value last month › is it increasing or decreasing?” ⤵
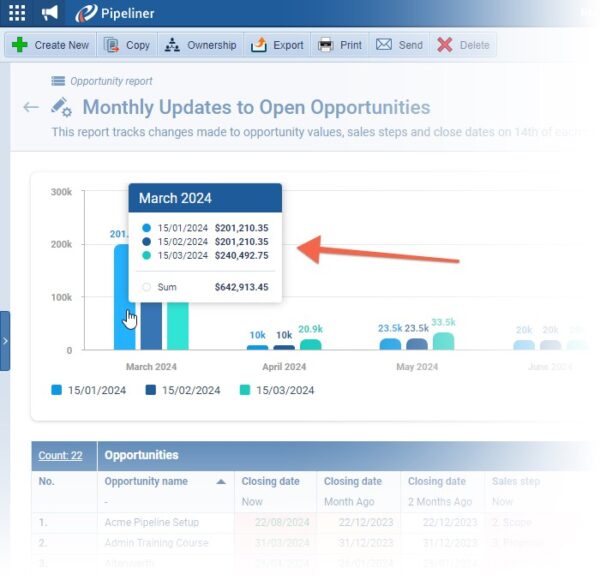
Users can select from one of 4 pre-defined report structures or choose the custom option to create their own structure. All reports will either compare what the values were/are in particular fields on set comparison dates, or display a historical trend. ⤵
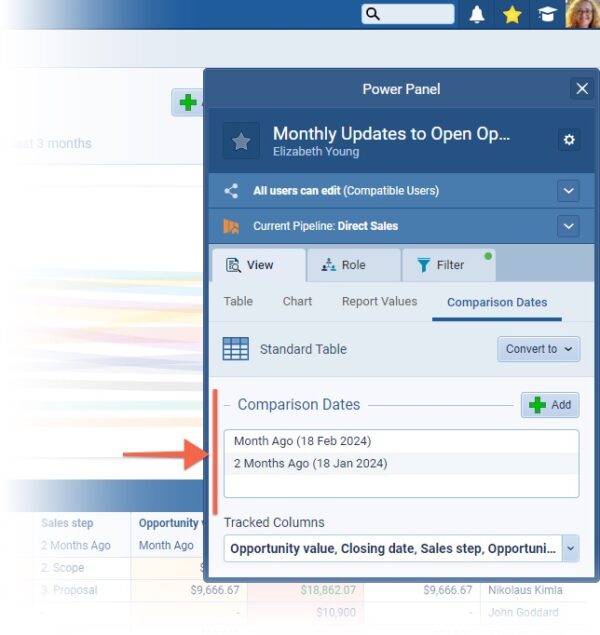
When using “Comparison Dates“, the comparison date represents a single day in the history of that record. This can be a specific date which will be the same every time a userUser User means a person who uses or consumes a product or a service, usually a digital device or an online service. opens the report or it can be a dynamic date — relative to the current date. More than one comparison date can be defined. In “Tracked Columns“, users select the fields (which must be visible in the “Change Log” from the “View Changes” button) that they are interested in tracking value changes for. For every combination of comparison date and tracked column, a new column will be visible in the “Table” section of the “Report Settings“. This allows users to see what the value is now vs what it was on the chosen comparison date(s). ⤵
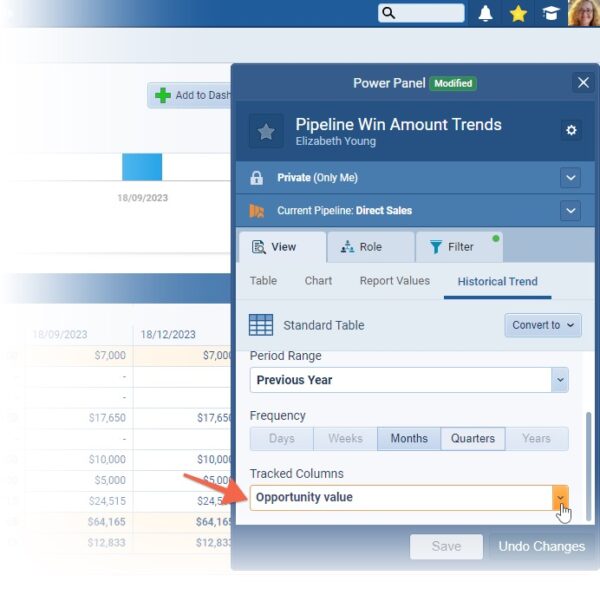
Historical trends represent a series of dates, similar to comparison dates and can be used when a user wants to track changes over a longer period of time. The user also defines the frequency of generated comparison dates relative to the chosen period — for example, track values over the last year with a quarterly frequency. The only fields supported as “Tracked Columns” for historical trends are numeric fields. One historical column is created for each tracked field column (for example, Opportunity Value over the Previous Year) and, when added to the report, will display with sub columns for each frequency (e.g. a value will be displayed for each quarterQuarter Quarter is a three-month period in a company’s fiscal year commonly used to make comparative performance analyses, detect or forecast business trends, report earnings, and pay shareholder dividends. of the previous year if the chosen frequency was Quarterly). ⤵
Historical reports can be also visualized as “Dashboard” charts. A limited subset of chart types is supported based on the type of historical report:
- Comparison Dates reports supports: “Scorecard“, “Column“, “Bar” and “Sankey” chart (this is a new chart type)
- Historical Trend reports support: “Line“, “Column” and “Bar” chart
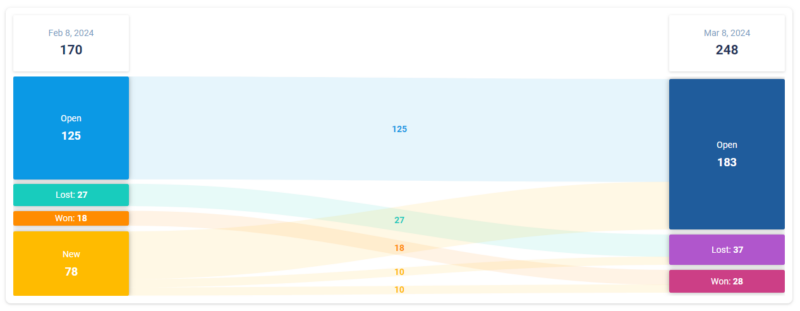
More information about Sankey diagrams
“A Sankey diagram is a visualization used to depict a flow from one set of values to another. The things being connected are called nodes and the connections are called links.”
In our historical reports based on “Comparison Dates“, we are using Sankey charts to represent the “flow of time” from past record values to the present, or any other date in the past. Users need to choose exactly two dates but can choose different node groupings for each date.
Fullsize Screenshots ⤵


Calculated Formulas
Customers have been asking for the option to use more advanced calculations in fields in Pipeliner so that calculations work not only with numbers, but also with text, dates etc, plus the ability to use the same sort of functions that they are familiar with using in Excel, for example.
We’ve taken this feedback on board and, in this major upgrade of calculation fields, we bring a whole new experience of working with calculations and formulas to meet most expectations and needs.
This enhancement is composed of:
- A new “Formula Editor“
- The previous formula edited has been updated with a new, more intuitive, editor
- A brand new field type of “Formula” field containing all new functions
- New “Calculated Report Value” › basically it is a new “Formula” field working within a “Report” (similar to the workings of Summary values from our last release)
- Updated “Web resource” fields with a new editor
- Updated “Calculated validations” on form fields with a new editor
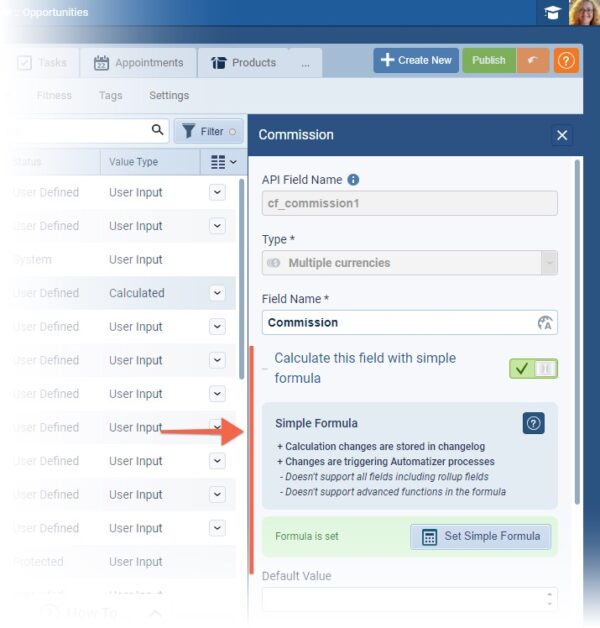
Simple Calculations
Simple calculation fields work in the same way as they have done previously but the new editor makes them easier to set up.
The same functions are available and existing calculated fields are fully compatible with the new editor so there’s no need to update. ⤵
The characteristics of fields using simple calculations remains the same i.e.:
- Triggering Automatizer processes
- Realtime recalculations on form when edits are made
- “Change log” support
Supported fields include:
- Base Currency
- Multiple Currencies
- Float
- Integer
“Rollups” (user-defined or system) and “Formula” fields (the new calculation type field) are not supported within simple calculations.
New Advanced Calculations › Formula field
The new Formula field type is a special ‘virtual’ field that allows users to use all the new functions in the new formula editor.
The characteristics of the new Formula field are:
- Real time calculations — the field is always re-calculated at the current time, unlike for simple calculations, the value is not pre-calculated and stored in the database so changes are not recorded in the change log and cannot be used for triggering Automatizer processes.
All fields within the entity are supported, including:
- Rollup fields
- Formula fields
- Simple calculated fields
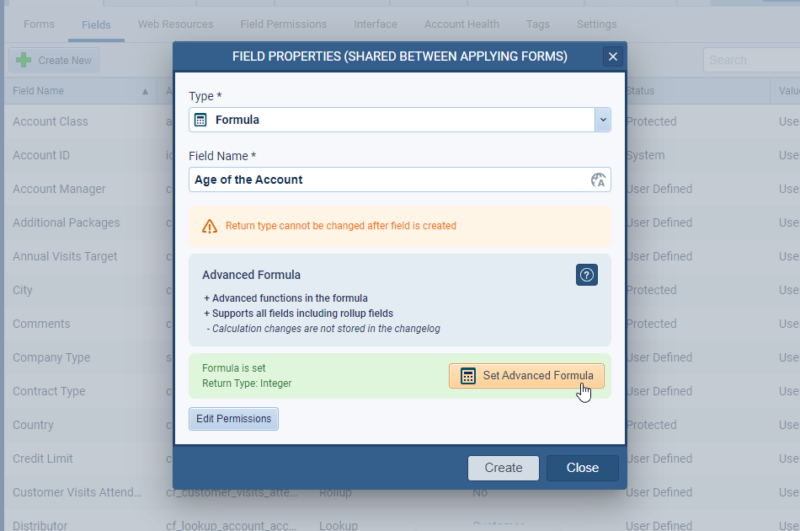
New Advanced Editor
Users can define the return type when creating the field. Once this is set, the return type cannot be changed after the field is created. Users need to ensure that they are using return types appropriate to the functions they are using in their formula.
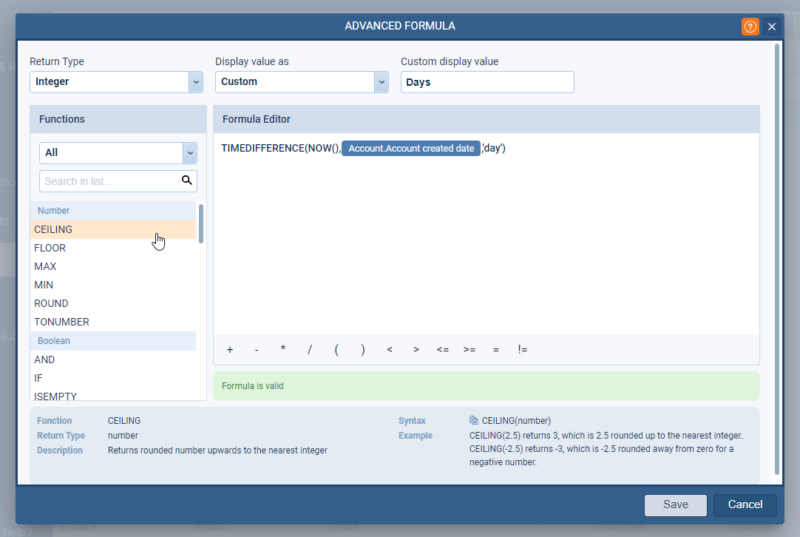
For specific return types there are also other options:
- “Integer” › user can select the displayed value suffix (for example: “3 y“, “99 %“, “123 days“, “42 kg“, “108 unicorns“, etc…)
- There are a few already predefined
- Days › “d”
- Months › “m”
- Years › “y”
- Percentage › “%”
- Custom › user can add any text (max 8 chars)
- There are a few already predefined
- “Float” › like integer + decimal places
- “Currency” › user can set only decimal places
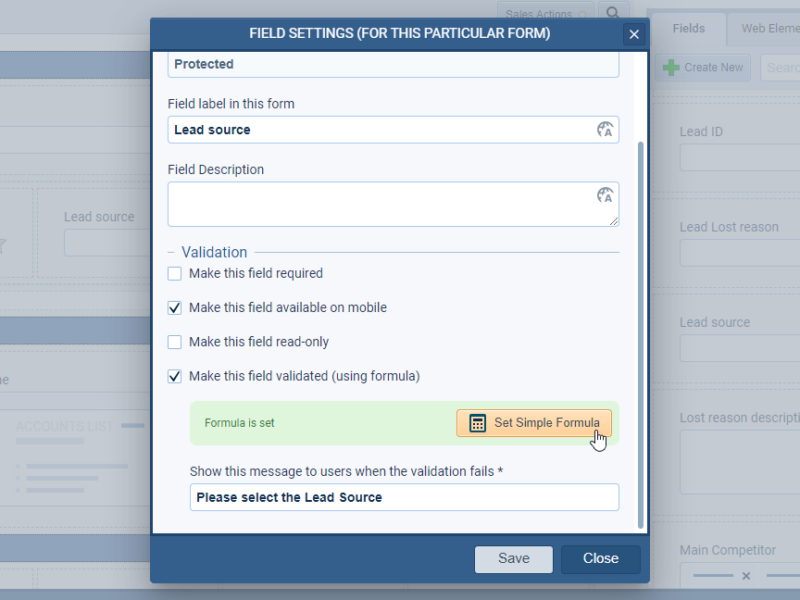
Calculated Validations
- Field validation by formula is now improved with access to the new formula editor
- Checking & validation behavior remains as before
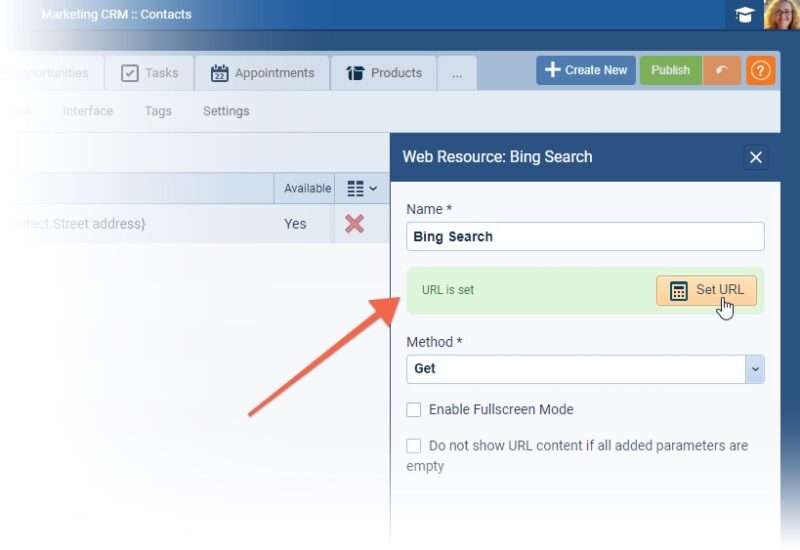
Web resources
Web resource fields can also now be set up via a new editor allowing easier field selection and a clearer display of the real field name in the list view. ⤵
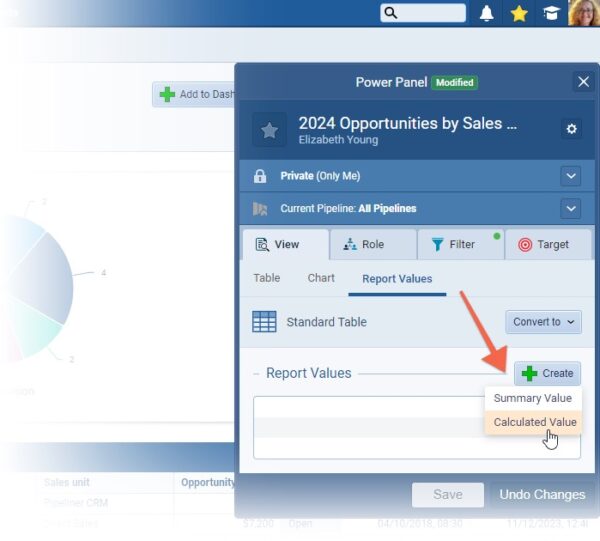
Calculated Report Value
In a similar way to our “Summary Value” fields from our last release, users are not able to create “Calculated Values” directly within a report. Just like “Summary Values“, the value exists only in the report where it is created. ⤵
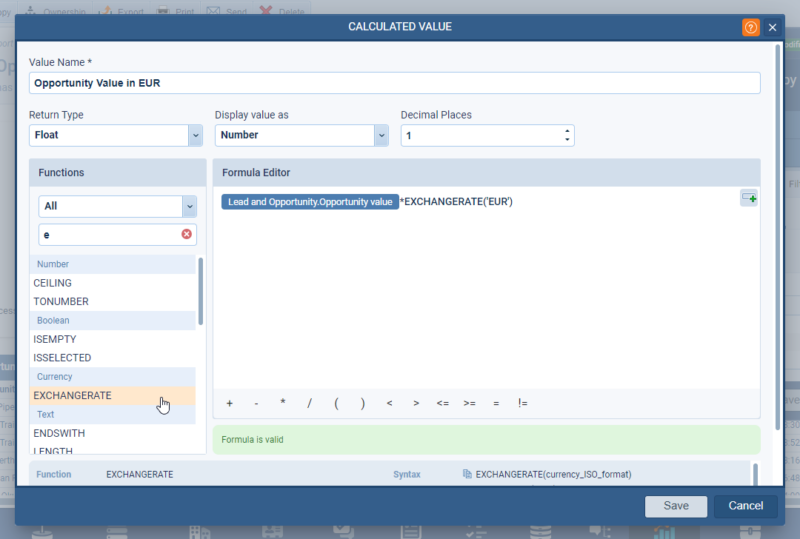
Calculated Value Editor
- User needs to add the value name › “required“
- It will work the same way as the Formula field editor and supports the same functions and fields
- In addition a calculated value can work also with a “summarization” value (but a summarization value cannot work with a calculated report value)
- User can use the calculated report value in charts and filters
Users need to add the “Calculated” value field to the report just like any other field. ⤵
Fullsize Screenshots ⤵


Card View Customizations / Card View Support for Lookup Fields
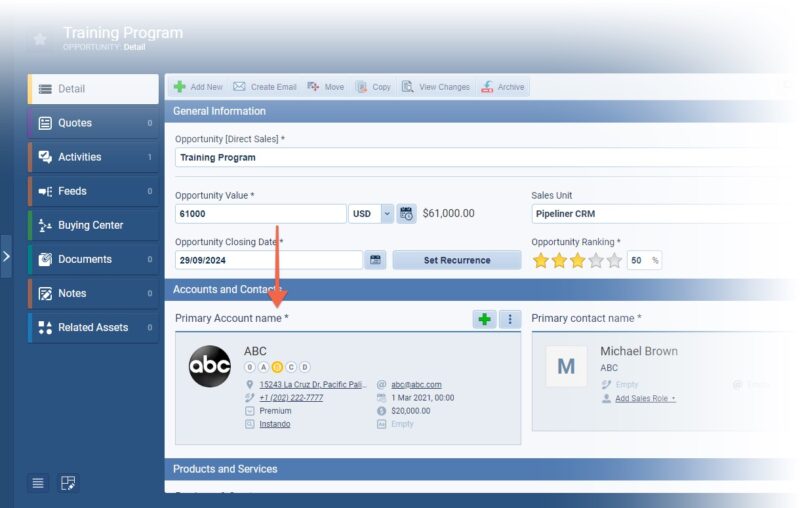
Admins can now update the fields that are visible on the card fields such as “Primary AccountAccount Account refers to a record of primary and background information about an individual or corporate customer, including contact data, preferred services, and transactions with your company.“, or “Primary Contact“,on “Opportunity” or on “Lookup” fields. ⤵
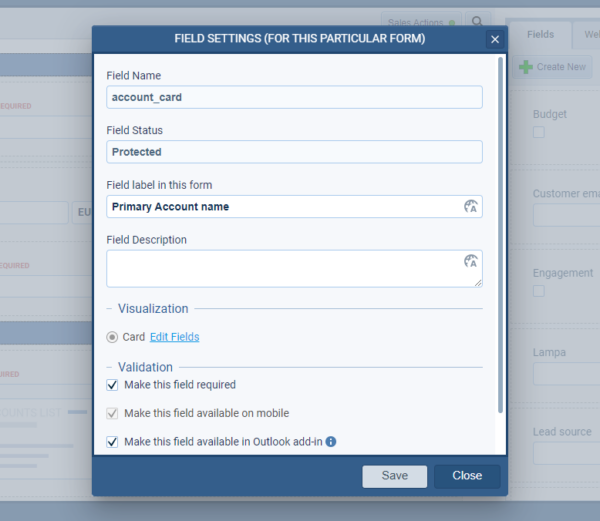
Edit the Form in the Admin module, select “Modify Field Form Settings” and then “Edit Fields” for the “Card“. If you update the fields, they will apply wherever you view types of that record on different Forms. ⤵
Fullsize Screenshots ⤵


Tracking Activities Based on the Location
We’ve added a new Automation Hub option “Location Tracking” to give customers who need it the ability to track the location where appointments or other activities take place. Once active in the Automation Hub, users will need to enable the new “Location Tracking” for Activities option in the Mobile App settings and will then will create “Appointments“, or other activities, using the Pipeliner Mobile app when they are at the meeting location and the coordinates will be stored to the activities in a new, read only “Geolocation” field.
Once all Activities are synced from the Mobile App to the web app, it will be possible to add the Geolocation field to the “Activities List View” and clicking on the “Geolocation” field will show a map view with the location of where that Activity was created. ⤵
![]()
Fullsize Screenshots ⤵
Experience Pipeliner CRM Now
As part of our ongoing usability enhancement program, we’ve updated the following features.
Various Improvements
Inviting Multiple Users
When creating users, admins can now copy and paste multiple email addresses, separated by commas, in order to invite multiple new users at once.
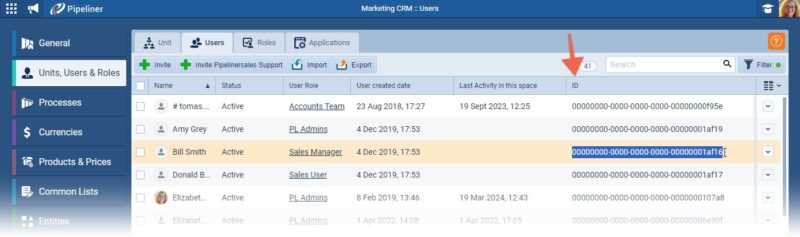
API › User and Sales Unit IDs
It’s easier for Developers working with our open API to access the ID for users and sales units. Pipeliner Admin Users can now add “ID” as a visible column for sales units and for users in the Admin Module for ease of access. ⤵
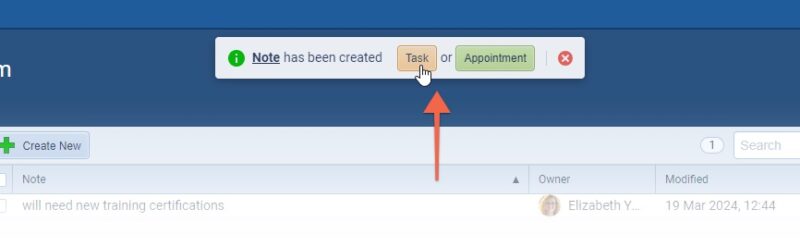
Notes › Follow Up Activities
When “Notes” are created, users are now prompted to create follow up activities. ⤵
Fullsize Screenshots ⤵


Theory Made Real
Based on proven economic principles, Pipeliner CRM is a tool for everyone. Read more