
Leading Indicators › LEADS

InboundInbound Inbound refers to interest (could be sales or marketing driven) that comes in – e.g. cold emails to you, submitted forms on your website, press inquiries, etc. Leads

Outbound Leads
Leading Indicators › LEADS (continued)
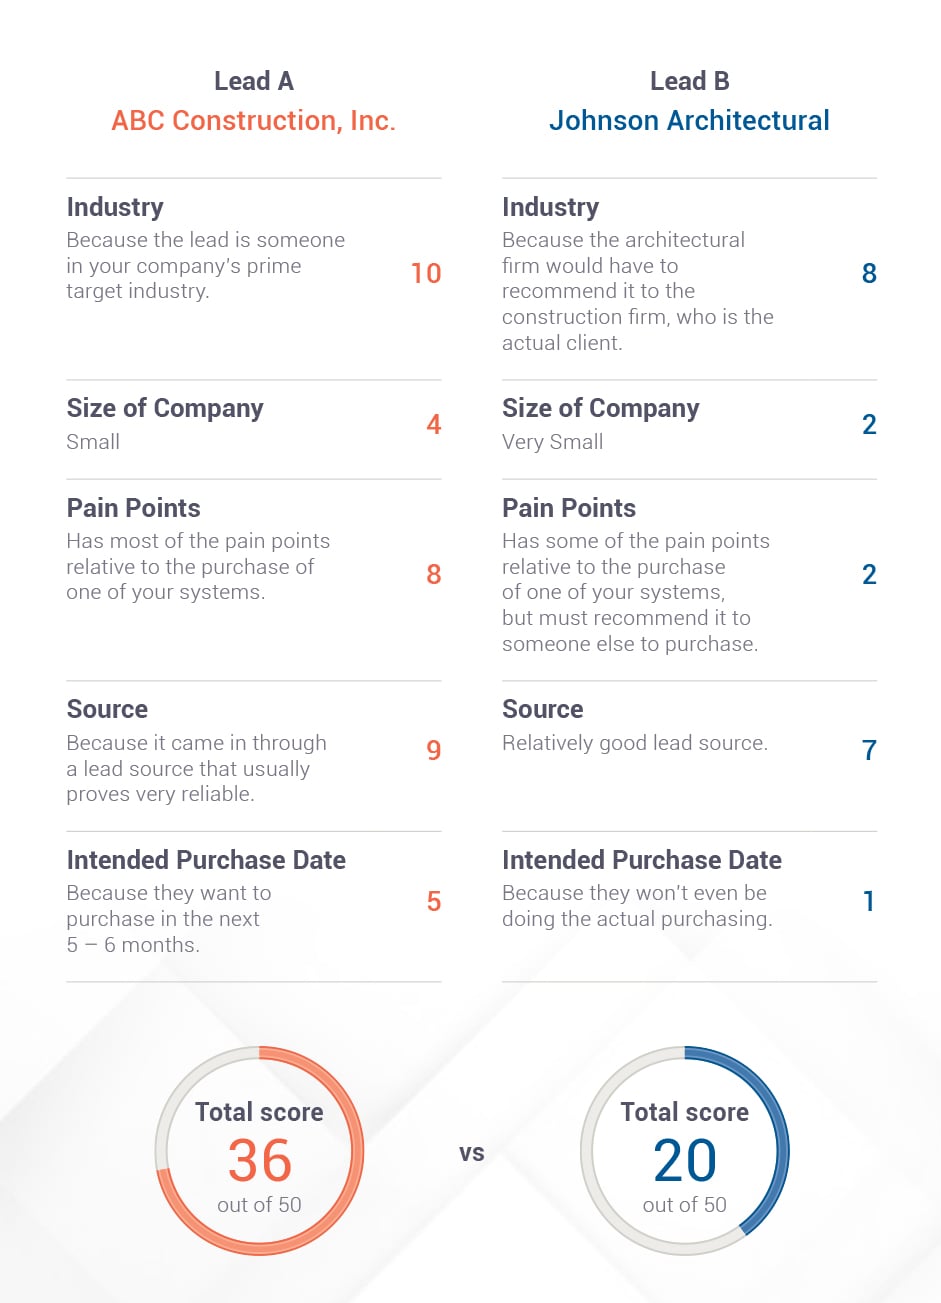
Lead ScoringLead Scoring Lead Scoring is the process of assigning a relative value to each lead based on different criteria, with the aim of ranking leads in terms of engagement priority.: Assigning a score to a leadLead Lead refers to a prospect or potential customer (who can be an individual or organization) that exhibits interest in your service or product; or any additional information about such entity. in your CRM makes it very easy for salespeople to prioritize which leads to immediately focus on. Identify what the most important characteristics of any opportunity are needed in order to make it the right fit for your business.

Industry

Size of company

Key pain points that your solutionSolution Solution is a combination of ideas, strategies, processes, technologies and services that effectively helps an organization achieve its goals or hurdle its challenges. solves

Source

Intended purchase date
You’ll need to know the overall qualification rate of leads to opportunities. Here is a good formula for figuring that out:

You’ll need to know the size of your average opportunity. A good formula for figuring that out is:

You also have the issue of the number of leads your sales team can handle. Here is the first formula for figuring this out for the team:

The formula for figuring out what lead volume an individual sales rep can handle is:
![]()
Once leads convert to opportunities, then it is a matter of figuring out how many winning deals it takes to profitably sustain the company’s pipelinePipeline Sales pipelineis a visual representation of the stage prospects are in the sales process., and monitoring that. You’ll now need to know your Win Rate for opportunities— basically the opportunity-to-close conversation rate, the number of deals that actually turn to wins.
Here is a great formula for that:

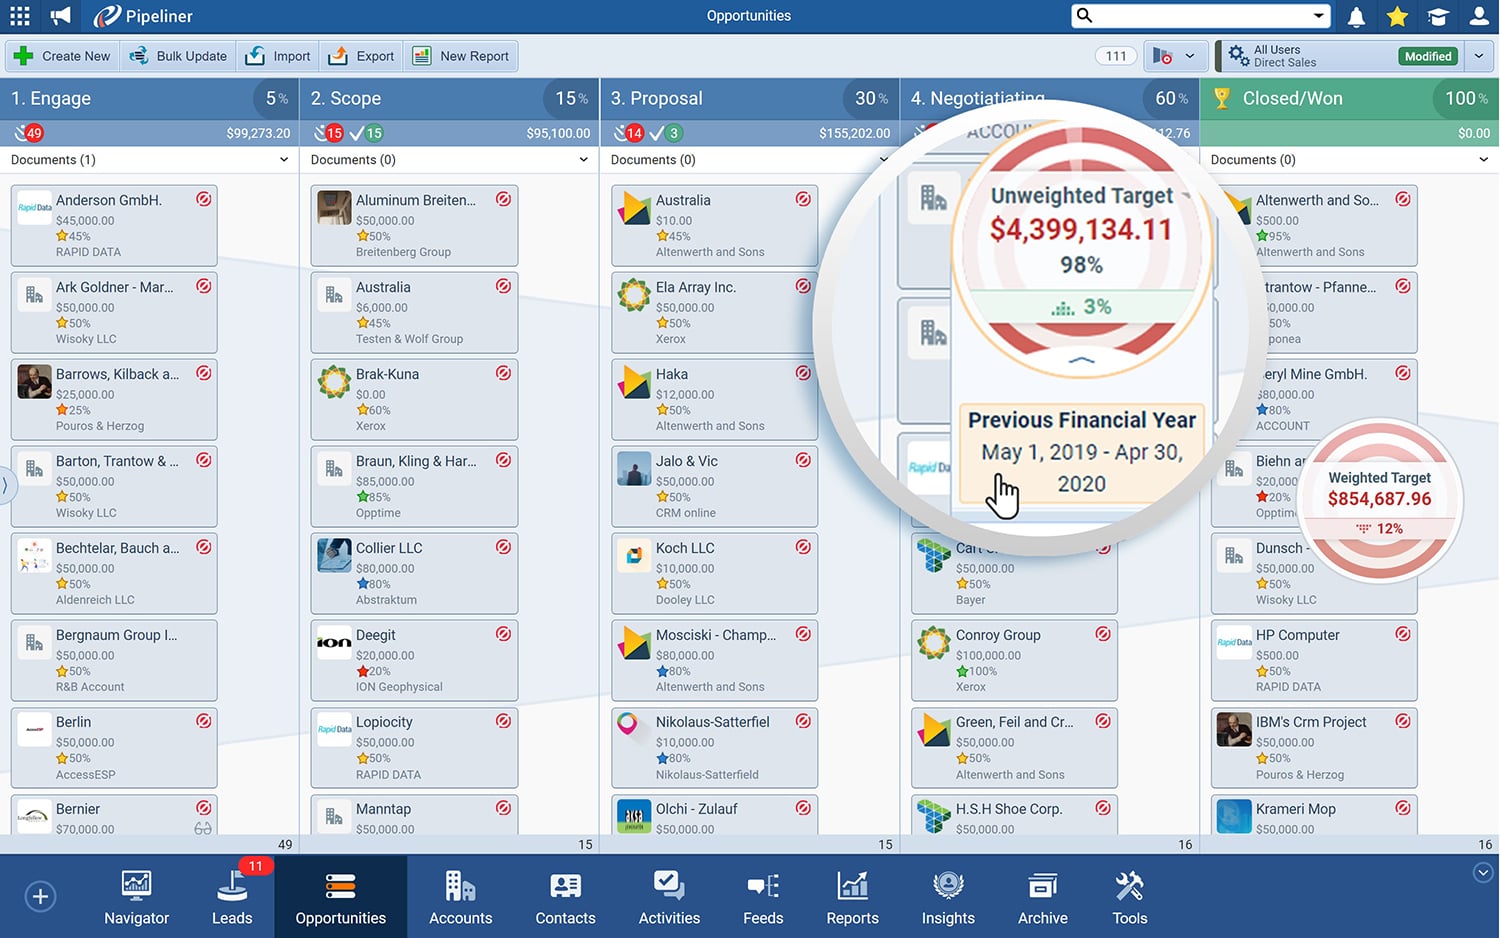
In the main Pipeline view, you can see how many leads are available, how many opportunities are in each stage of the pipeline, and how many are overdue (per the average length of time for each stage).
Your primary leading indicators are right here:
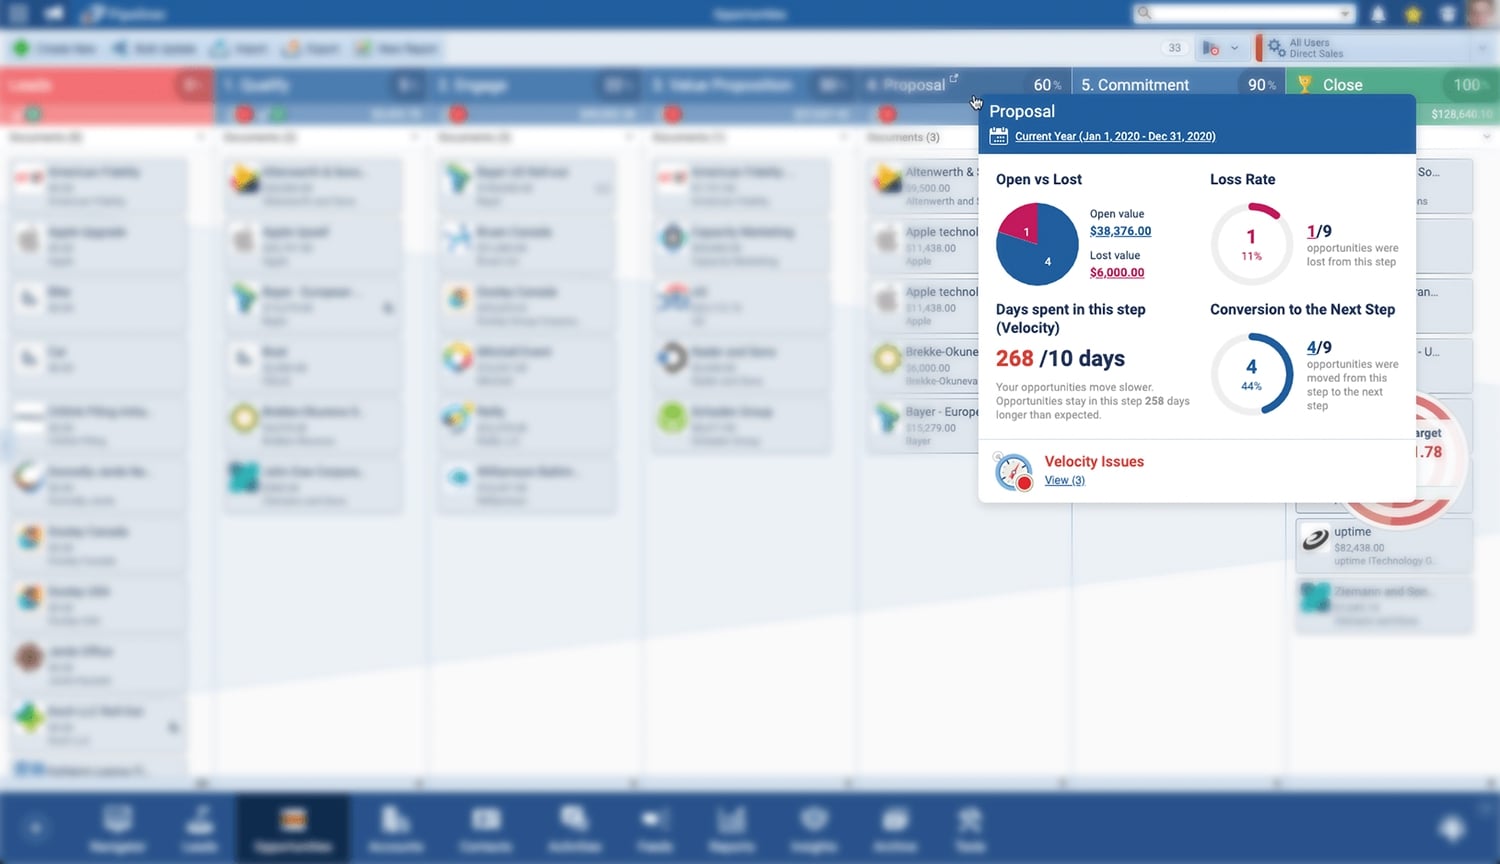
On the right-hand side, the target is always visible, showing your primary lagging indicators, and how they are affected by all the leading indicators as they now stand.
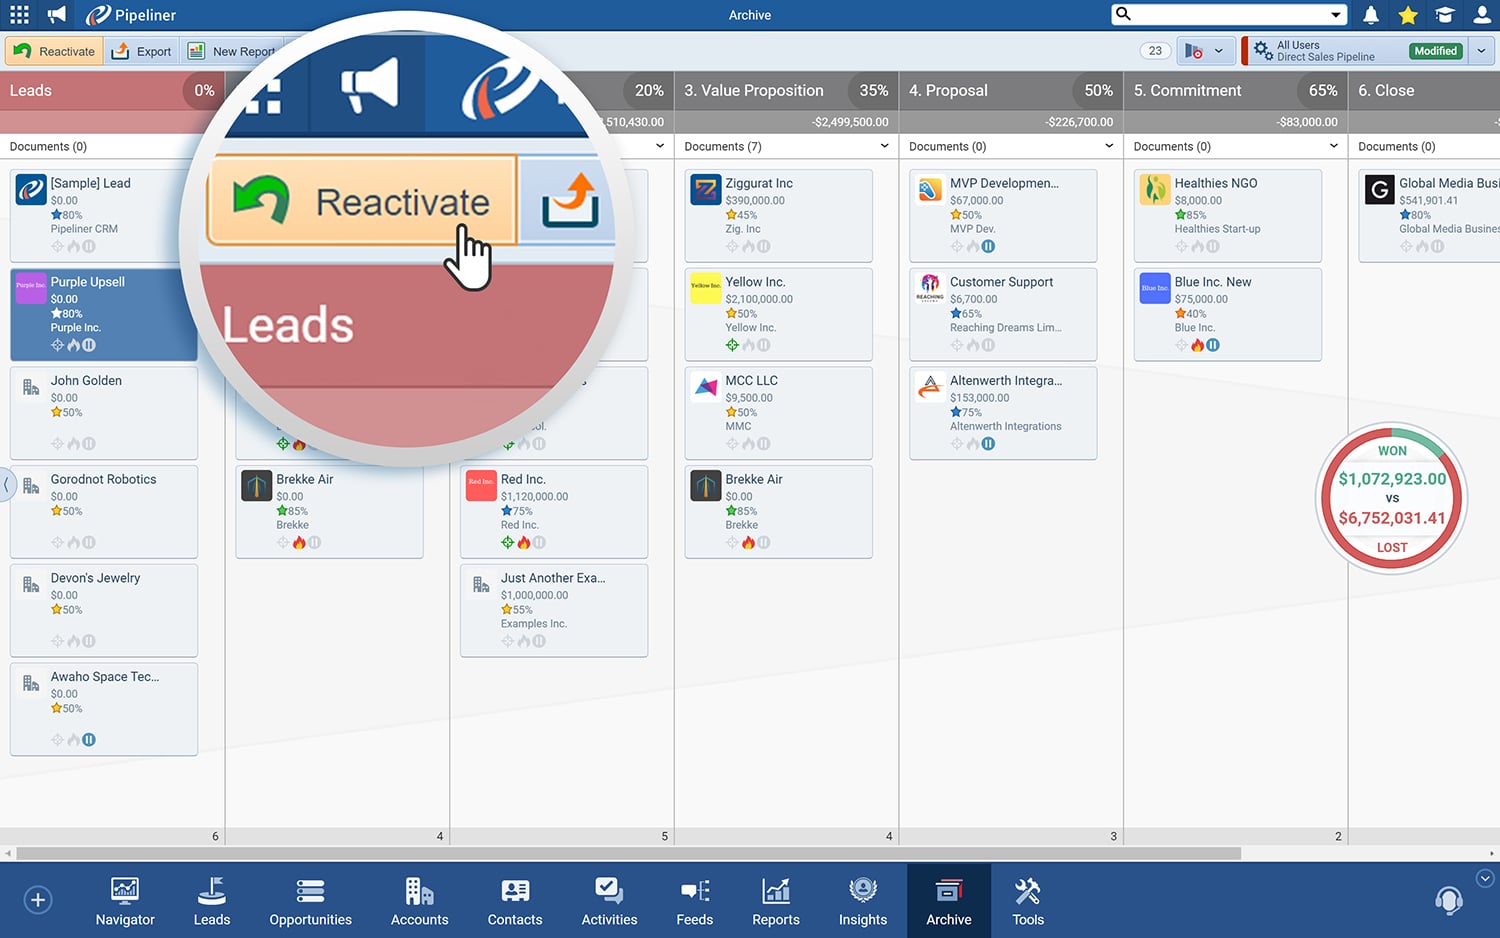
In Pipeliner, the most important lagging indicator is something not available in any other CRM: the Archive. The Pipeliner CRM Archive is arranged exactly the same as the active pipeline view. Leads and opportunities contain all information present when they were archived—including Documents, Emails, Notes, Social Media interactions, Tasks, and Activities.
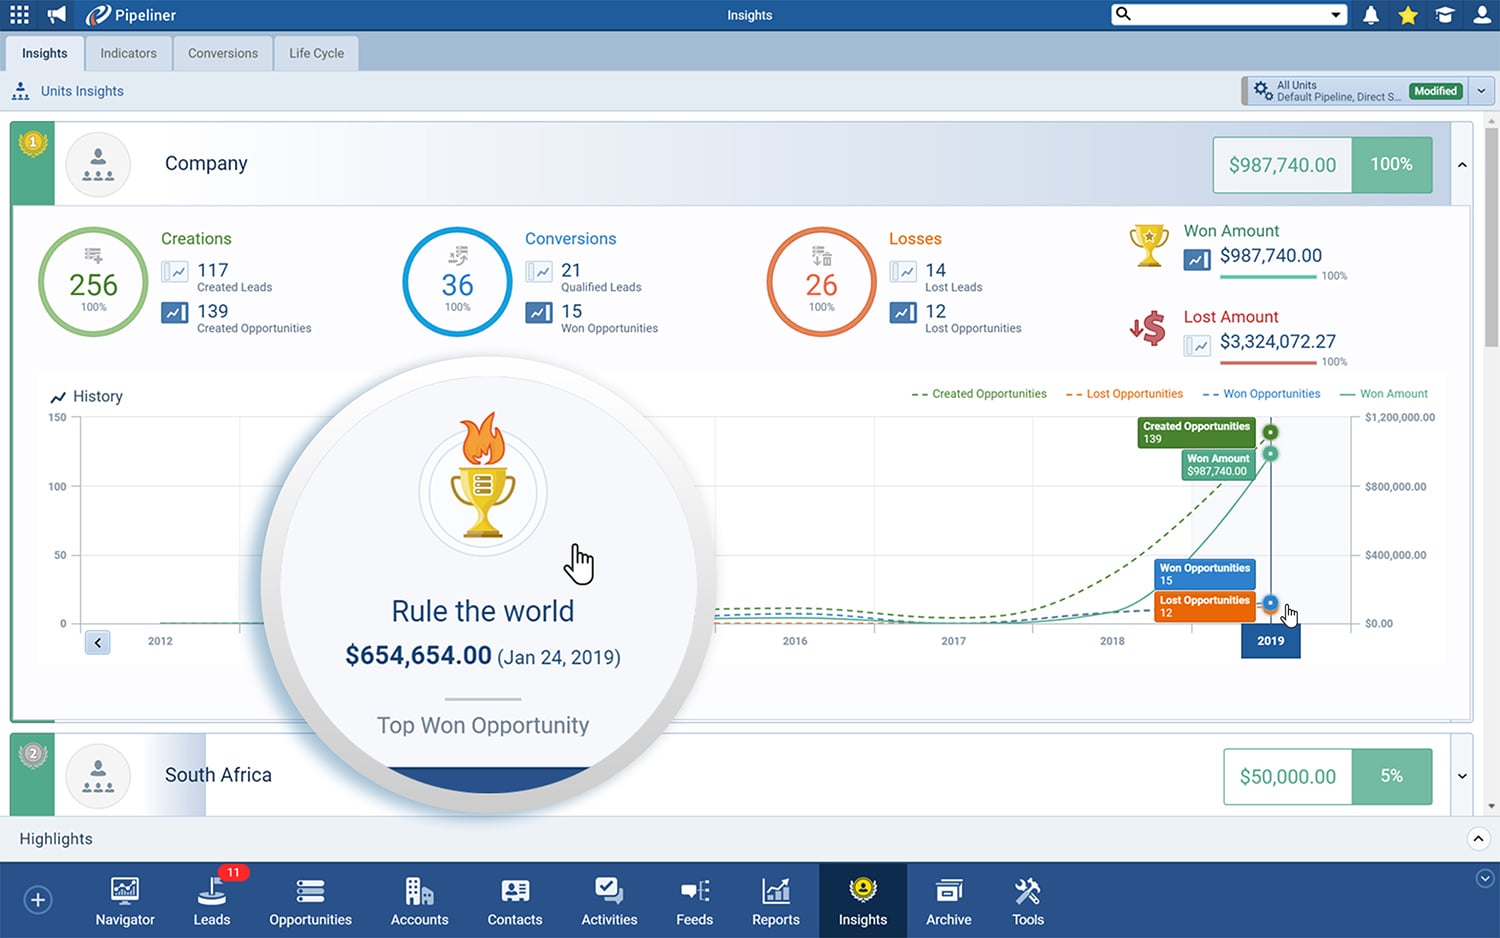
As you can see, it’s not just the indicators, but how they are displayed and used. And with Pipeliner, that view has now gained another major improvement with its all-new feature called Sales Performance Insights. With Sales Performance Insights a sales leader or sales representative can see, at a glance, how various leading and lagging indicators have been combined so far for a sales unit, for reps as compared with other reps, and for territories as compared with others.
Not only can reps be compared, but so can various indicators for those reps.