Core Sales Forecasting Methods in CRM Systems
1. Opportunity Stage Forecasting
How it works: Assigns probability weights to each stage of your sales pipelineSales Pipeline Sales Pipeline is a type of visualization showing the status of each sales prospect in the customer life cycle or sales process.. For example: Discovery (20%), Proposal (50%), NegotiationNegotiation Negotiation is a strategic dialogue, discussion, or bargaining process between two or more parties with the goal of reaching a mutually acceptable agreement. (75%), Verbal Commit (90%).
When to use: Early-stage companies with limited historical data, or organizations with well-defined, consistently followed sales processes.
Accuracy factors:
- Stage definitions must be objective and observable (not subjective assessments)
- Reps must advance deals based on buyerBuyer A buyer is an individual or organizational entity that purchases a product or subscribes to a service. actions, not seller activities
- Stage probabilities should be calibrated to your actual historical win rates by stage
Common failure mode: Assigning arbitrary probabilities (10%, 25%, 50%, 75%) without validating against historical conversionConversion Conversion is the process of turning a target consumer into a paying customer; or more generally, the point at which a user performs a specific action favorable to a marketer or a seller. data. Most CRMs default to these round numbers, which rarely reflect actual performance.
Implementation in CRM: Most platforms support stage-based forecasting natively. The critical work is to calibrate your stage probabilities quarterly using trailing 12-month conversion data.
2. Historical Forecasting (Trend Analysis)
How it works: Projects future revenue based on historical growth patterns, accounting for seasonality and trend lines.
When to use: Mature businesses with 2+ years of historical data and relatively stable market conditions.
Accuracy factors:
- Requires clean, consistent historical data
- Must accountAccount Account refers to a record of primary and background information about an individual or corporate customer, including contact data, preferred services, and transactions with your company. for seasonality patterns (monthly, quarterly, annual)
- Should incorporate market condition adjustments for anomalous periods
Common failure mode: Applying historical growth rates during periods of significant business model changes, market disruption, or GTM strategy shifts.
Implementation in CRM: Requires robust reporting capabilities and data cleansing. Most effective when combined with other forecasting methods rather than used in isolation.
3. Length of Sales Cycle Forecasting
How it works: Uses average time-to-close data to predict when current opportunities will convert, then aggregates expected close dates.
When to use: Organizations with consistent sales cycles and good data hygiene around opportunity age and progression.
Accuracy factors:
- Sales cycle length must be measured by deal size, source, or segment
- Requires accurate opportunity creation dates and stage movement timestamps
- Should account for deals that have stalled beyond the typical cycle length
Common failure mode: Using the company-wide average sales cycle length without segmentationSegmentation Segmentation is the process of subdividing a large market into distinct partitions (or segments) based on demographics and other factors, with the aim of formulating and implementing separate strategies to better engage the consumers in each segment.. A $10K SMB deal and a $500K enterpriseEnterprise Enterprise (in the context of sales) is a relatively large organization typically composed of multiple levels, locations, and departments which need multi-layer software systems that support collaboration across a large corporate environment. deal have vastly different cycles.
Implementation in CRM: Requires date stamping on opportunity creation and stage changes. Most advanced when the CRM can automatically flag deals that exceed the expected cycle length.
4. Intuitive Forecasting (Rep Input)
How it works: Sales reps assess each opportunity and provide their best judgment on the likelihood to close and the expected close date.
When to use: Complex, relationship-driven sales where quantitative factors don’t capture deal nuance. Often combined with other methods.
Accuracy factors:
- Rep incentives must reward accuracy, not optimism
- Requires regular forecast review conversations
- Works best when sandbagging vs. overcommitment is tracked and managed
Common failure mode: Reps inflate forecasts to appear busy or deflate them to sandbag and beat expectations. Without accountability mechanisms, intuitive forecasting degrades into political gamesmanship.
Implementation in CRM: Most CRMs allow reps to set custom commit amounts separate from the weighted pipeline. The key is tracking forecast accuracy by rep over time.
5. Multivariable (AI/ML) Forecasting
How it works: Machine learning models analyze dozens of variables simultaneously—deal characteristics, rep behavior patterns, buyer engagementEngagement Engagement is the state or process of keeping a specific class of audience (employees, management, customers, etc.) interested about a company or brand and invested in its success because of its perceived relevance and benefits to the audience. signals, historical outcomes—to generate probability scores.
When to use: Organizations with large datasets (1000+ closed opportunitiesClosed Opportunities Closed Opportunities is a general term encompassing closed-won and closed-lost opportunities.), mature CRM data practices, and data science capabilities.
Accuracy factors:
- Requires extensive clean historical data
- Model needs regular retraining as market conditions shift
- Works best when combined with human oversight for deal-specific context
Common failure mode: Treating the model as a black box without understanding which variables drive predictions. Also, training on biased historical data perpetuates existing process flaws.
Implementation in CRM: Available through advanced CRM platforms (Salesforce Einstein, Microsoft Dynamics AI) or specialized forecasting tools that integrate with your CRM.
Experience Pipeliner CRM Now
The Hidden Variable: How CRM Data Structure Impacts Forecast Accuracy
Most forecasting conversations focus on methodology. But forecast accuracy is fundamentally limited by CRM data quality and architecture.
Data Hygiene Issues That Destroy Forecasts
Phantom pipeline: Opportunities that should have been closed, lost months ago, are still sitting in the forecast, artificially inflating projections.
Stage inflation: Reps advancing deals to later stages prematurely to appear productive, creating false confidence in near-term revenue.
Close date drift: Continuously pushing close dates forward without moving deals to closed-lost, masking actual loss rates.
Opportunity duplication: Multiple reps or systems creating separate records for the same deal, double-counting potential revenue.
Missing required fields: Incomplete data on deal size, product line, or source prevents accurate segmentation and analysis.
Structural CRM Design Choices That Impact Forecasting
Stage granularity: Too many stages create complexity without improving accuracy. Too few stages miss important conversion insights. Optimal is typically 4-7 stages with clear exit criteria.
Opportunity splitting: Whether you allow single opportunities with multiple products/quantities, or require separate records, affects forecasting granularity and accuracy.
Close date enforcement: Systems that allow infinite close-date pushing versus those that auto-close stale opportunities produce vastly different forecast reliability.
Required field strategy: Forcing reps to complete fields (competitor, decision criteria, economic buyer identified) improves forecast context but slows deal entry.
Historical data retention: Deleting old lost opportunities eliminates the historical baselineBaseline Baseline refers to a minimum level or starting point from which further measurements or comparisons can be made for analyses, forecasting, performance improvement or strategy formulation. needed to calibrate probability weights.
The Visual Forecasting Problem
Most CRM forecasting interfaces prioritize current pipeline visibility over tracking historical accuracy. Reps see their weighted pipeline number but not their forecast accuracy trend over the past six quarters.
This creates a natural optimism bias. Without regular feedback showing how their forecasts compare to actual outcomes, reps have no incentive to calibrate their predictions.
Best practice: Implement quarterly forecast accuracy reviews that show each rep their committed forecast vs. their actual closed revenue, with trend lines over time.
Common Sales Forecasting Failure Modes
Understanding where forecasts typically break down helps you build more resilient processes.
Failure Mode 1: The Sandbagging Problem
What happens: Reps consistently forecast 60-70% of what they actually close, creating a false scarcity that makes them look heroic when they “beat” their number.
Why it happens: CompensationCompensation Compensation is the total payment and benefits an employee receives for rendering work — covering basic salary, allowances, commissions, bonuses, health insurance, pension plans, paid leaves, stock options, and other benefits. and recognition systems that reward exceeding forecast rather than accuracy.
How to fix: Track and publish forecast accuracy (not just attainment). Recognize reps who consistently forecast within ±5% of actual, not those who sandbag and beat by 30%.
Failure Mode 2: The Commitment-to-Close Disconnect
What happens: Leadership commits one number to the board while sales commits a different (usually lower) number to management.
Why it happens: Multiple forecasting categories (pipeline, best case, commit, worst case) without clear definitions of how they should relate.
How to fix: Align on single forecast definitions. If using multiple categories, establish mathematical relationships among them using historical data.
Failure Mode 3: The Recency Bias Trap
What happens: Recent wins create overconfidence, leading to inflated forecasts. Recent losses create pessimism, leading to deflated forecasts.
Why it happens: Human psychology naturally overweights recent events when predicting future outcomes.
How to fix: Implement quantitative forecasting methods that consider 12+ months of historical data rather than relying purely on intuitive assessments.
Failure Mode 4: The False Precision Problem
What happens: Forecasting systems that project revenue to the dollar (e.g., $1,847,392) when actual accuracy is ±15%, creating false confidence.
Why it happens: CRM systems aggregate individual opportunities without reflecting prediction uncertainty.
How to fix: Present forecasts as ranges with confidence intervals. Report “$1.8M – $2.1M at 80% confidence” rather than false precision.
Failure Mode 5: The New Rep Blind Spot
What happens: New sales reps with minimal historical data skew forecasts wildly during their ramp period.
Why it happens: Forecasting systems treat new reps identically to tenured reps despite vastly different performance patterns.
How to fix: Segment forecasts by rep tenure. Apply different probability weights or methodologies for reps in their first 90 days vs. fully ramped reps.
Failure Mode 6: The Product Mix Miscalculation
What happens: Forecasts hit the right total revenue number but miss product mix, creating supply chain or delivery problems.
Why it happens: Forecasting rolls up to total revenue without tracking product-level accuracy.
How to fix: Forecast and track accuracy at the product line or SKU level for businesses where mix matters for operations.
CRM Forecast Evaluation Checklist
Use this checklist quarterly to assess and improve your forecasting system:
Data Foundation
- [ ] Opportunity stage definitions are objective and based on buyer actions
- [ ] Stage probability weights are calibrated against trailing 12-month actual conversion rates
- [ ] Required fields critical to forecasting (close date, amount, stage) have 95%+ completion
- [ ] Stale opportunities (30+ days beyond the typical sales cycle) are automatically flagged
- [ ] Duplicate opportunity detection runs weekly
- [ ] Historical win/loss data is retained for a minimum of 24 months
Process Alignment
- [ ] Forecast definitions (pipeline, best case, commit) are documented and understood
- [ ] Forecast submission deadlines are enforced consistently
- [ ] Forecast vs. actual performance is reviewed in 1:1s with every rep
- [ ] Forecast accuracy metrics are visible in dashboards
- [ ] Incentive systems reward accuracy, not optimism or sandbagging
Methodology Appropriateness
- [ ] Forecasting method matches business maturity (stage-based for early-stage, multivariable for mature)
- [ ] Segmentation exists for different sales cycles (SMB vs. Enterprise, new logo vs. expansion)
- [ ] Seasonality is accounted for in annual businesses
- [ ] New rep ramp periods are modeled separately from fully tenured reps
- [ ] Product/solutionSolution Solution is a combination of ideas, strategies, processes, technologies and services that effectively helps an organization achieve its goals or hurdle its challenges. mix is tracked where operationally relevant
Accuracy Measurement
- [ ] Forecast accuracy is calculated as: (Actual Revenue / Forecast) for each period
- [ ] Accuracy trends are tracked over 6+ quarters to identify improvement/degradation
- [ ] Accuracy is measured by rep, by segment, and by product line
- [ ] Root cause analysis occurs for >10% forecast misses
- [ ] Forecast accuracy targets exist and are communicated (typically ±10% for mature orgs)
System Capabilities
- [ ] CRM can generate weighted pipeline reports automatically
- [ ] Forecast snapshots are captured weekly to track forecast evolution
- [ ] Historical forecast vs. actual is easily reportable
- [ ] Reps can see their own forecast accuracy trends
- [ ] Leadership can see forecast accuracy by team/region
Leading Indicators
- [ ] Pipeline generation vs. target is monitored 60-90 days ahead of revenue impact
- [ ] Pipeline coverage ratio (weighted pipeline/quota) is tracked by rep
- [ ] Sales cycle length trends are monitored for early warning signs
- [ ] Win rate trends by stage are reviewed monthly
- [ ] Average deal size trends are monitored for macro shifts

Sales Forecast TemplateTemplate Template is a generic file with a framework showing the standard sections or features of a specific kind of document, used to create a new document of the same type faster and easier. for CRM Implementation
This lightweight template provides the minimum structure needed for effective CRM forecasting. Customize based on your sales motion and organizational complexity.
📑 Template 1
Opportunity-Level Forecast Fields
Every CRM opportunity should include these minimum fields for accurate forecasting:
Required Fields:
- Opportunity Name
- Account Name
- Expected Close Date
- Opportunity Amount
- Current Stage
- Probability % (auto-populated based on stage, editable by rep)
- Forecast Category (Pipeline / Best Case / Commit / Closed)
- Opportunity Owner
Recommended Fields:
- Opportunity Source (InboundInbound Inbound refers to interest (could be sales or marketing driven) that comes in – e.g. cold emails to you, submitted forms on your website, press inquiries, etc. / Outbound / Partner / Expansion)
- Deal Type (New Logo / Expansion / Renewal)
- Product/Solution Category
- Competitor (if present)
- Close Date History (tracks all changes to close date)
- Stage Change Dates (timestamp for each stage progression)
Advanced Fields (for mature orgs):
- Economic Buyer Identified (Y/N)
- Champion Identified (Y/N)
- Technical Validation Complete (Y/N)
- Budget Confirmed (Y/N)
- Decision Criteria Defined (Y/N)
- ProcurementProcurement Procurement is the process of finding and acquiring goods and services, usually involving demand assessment, bid reviews, approval requests and transaction logging. Engaged (Y/N)
📑 Template 2
Weekly Forecast Submission
Reps complete this weekly, ideally in a recurring CRM report or view:
Week of: [Date]
Pipeline Summary:
- Total Weighted Pipeline: $______
- Number of Opportunities: ______
- Largest Deal: $______
- Pipeline Coverage Ratio: ______ (Weighted Pipeline / Remaining Quota)
Forecast Commitment:
- Commit (90%+ confidence): $______
- Best Case (70%+ confidence): $______
- Pipeline (all weighted opportunities): $______
This Week’s Changes:
- New Opportunities Added: ______ ($ value)
- Opportunities Won: ______ ($ value)
- Opportunities Lost: ______ ($ value)
- Opportunities Pushed: ______ ($ value)
At-Risk Deals (Commit category opportunities with concern):
- [Opportunity Name] – [$ Amount] – [Risk Factor]
Top 3 Opportunities Most Likely to Close This Month:
- [Opportunity Name] – [$ Amount] – [Current Stage]
- [Opportunity Name] – [$ Amount] – [Current Stage]
- [Opportunity Name] – [$ Amount] – [Current Stage]
📑 Template 3
Quarterly Forecast Accuracy Review
Leadership reviews this with each rep quarterly:
Rep Name: ________________ Quarter: ________
Forecast vs. Actual Performance:
- Q Beginning Commit Forecast: $______
- Q Actual Closed Revenue: $______
- Variance: ______ (___%)
- Forecast Accuracy: ______% (100% – absolute variance %)
Trend Analysis:
- Q-1 Forecast Accuracy: ______%
- Q-2 Forecast Accuracy: ______%
- Q-3 Forecast Accuracy: ______%
- Q-4 Forecast Accuracy: ______%
- 4-Quarter Average: ______%
Forecast Behavior Patterns:
- Sandbagging Score: ______ (How often forecast < actual)
- Optimism Score: ______ (How often forecast > actual)
- Push Rate: ______% (Opportunities pushed from Q to Q+1)
- Stale Opportunity Count: ______ (Opps >30 days beyond typical cycle)
Root Cause of Largest Miss:
- Opportunity: ______
- Forecasted: $______
- Actual Outcome: ______
- Miss Reason: [Competitive Loss / Timeline Pushed / Budget Cut / Champion Left / Other]
Improvement Actions for Next Quarter:
📑 Template 4
Monthly Forecast Roll-Up (Leadership View)
Month: ________ Fiscal Period: ________
Team Forecast Summary:
| Rep Name | Quota | Closed MTD | Commit | Best Case | Pipeline | Coverage Ratio | Forecast Accuracy (Last 3M Avg) |
|---|---|---|---|---|---|---|---|
| Rep 1 | |||||||
| Rep 2 | |||||||
| Total |
Segment Analysis:
| Segment | Quota | Forecast | Variance | Win Rate MTD | Avg Deal Size | Sales Cycle |
|---|---|---|---|---|---|---|
| SMB | ||||||
| Mid-MarketMid-Market Mid-Market is a classification of business organizations in terms of scale (revenue, number of employees, etc.), occupying the segment between the small companies and large multinational enterprises serving the same market. | ||||||
| Enterprise |
Pipeline Health Metrics:
- Total Pipeline Value: $______
- Weighted Pipeline: $______
- Pipeline Coverage Ratio: ______ (Target: 3-4x for most orgs)
- Pipeline Generation MTD: $______
- Pipeline Conversion Rate MTD: ______%
Early Warning Indicators:
- Reps Below 3x Coverage: ______ (List names)
- Forecast Accuracy <85%: ______ (List names)
- Win Rate Decline >10%: ______ (List segments/reps)
- Sales Cycle Extension >15%: ______ (List segments/products)
Risks to Forecast:
Upside Opportunities:
Choosing CRM Forecasting Software in 2026
Most modern CRMs include basic forecasting capabilities, but there are significant capability differences worth understanding.
Native CRM Forecasting
Salesforce Sales Cloud
- Strengths: Collaborative forecasting, forecast snapshots, Einstein AI predictions, customizable forecast categories
- Limitations: Setup complexity, requires admin expertise, Einstein AI requires additional licensing
- Best for: Mid-market to enterprise B2BB2B B2B is an acronym for Business-to-Business, a model for selling, relationship-building, or engagement. companies with dedicated RevOps resources
HubSpot Sales Hub
- Strengths: Intuitive interface, easy setup, good for SMB, included in Professional tier
- Limitations: Limited customization, basic probability weighting, no built-in forecast snapshots
- Best for: SMB companies, teams without dedicated CRM admins, businesses prioritizing ease of use
Microsoft Dynamics 365
- Strengths: Deep Excel integration, AI-driven insights, strong enterprise features
- Limitations: Steeper learning curve, requires Microsoft ecosystem, premium features require higher tiers
- Best for: Enterprise orgs already using Microsoft stack, complex B2B sales
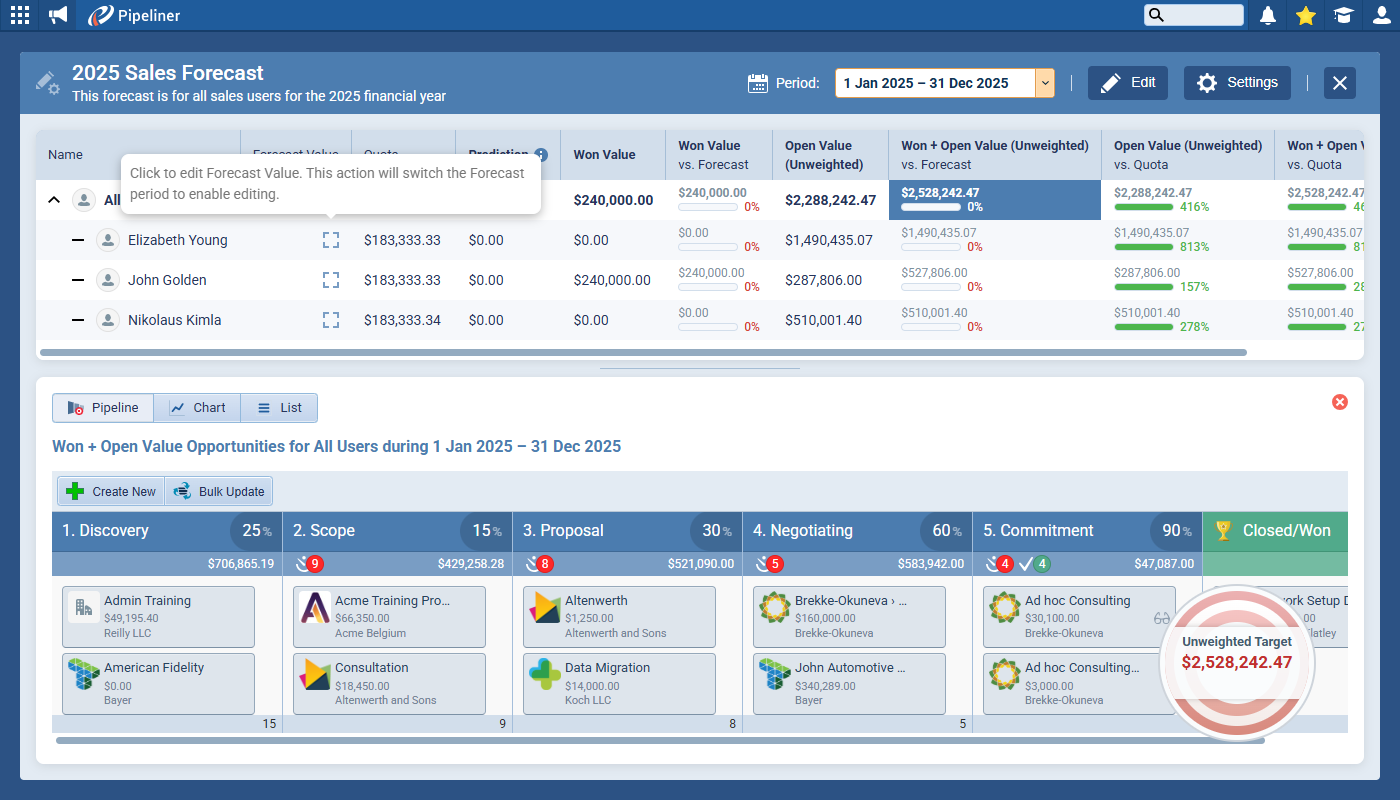
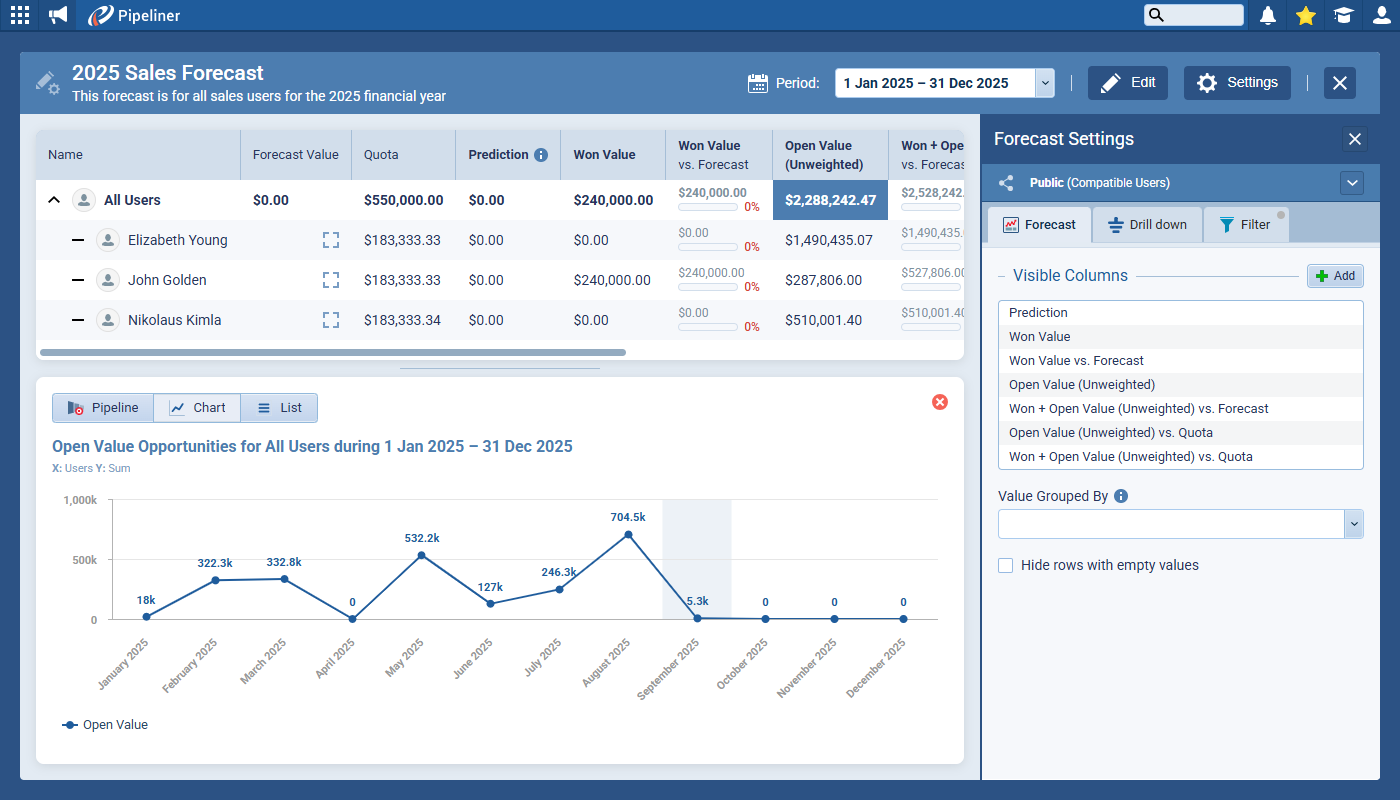
Pipeliner CRM
- Strengths: Visual pipeline management, intuitive forecasting interface, built-in analyticsAnalytics Analytics is the active study of different types of data with the aim of discovering meaningful patterns and translating these into insight (such as historical analyses and forecasts), or action (such as those intended to improve business performance)., no-code customization
- Limitations: Less ecosystem of third-party apps compared to Salesforce
- Best for: Mid-market B2B, teams wanting powerful forecasting without enterprise complexity
Pipedrive
- Strengths: Simple probability-based forecasting, visual pipeline, affordable
- Limitations: Limited advanced forecasting features, basic reporting
- Best for: Small sales teams, transactional sales motions, early-stage companies
Specialized Forecasting Tools (CRM Add-Ons)
Clari
- Purpose-built forecasting and revenue operations platform
- Integrates with Salesforce, tracks forecast changes, provides inspection tools
- Best for: Enterprise orgs with complex forecasting needs and large sales teams
Aviso
- AI-powered forecasting with deal risk scoring and opportunity insights
- Integrates with major CRMs, focuses on reducing forecast error
- Best for: Organizations prioritizing forecast accuracy over ease of implementation
InsightSquared (now part of Mediafly)
- Revenue intelligence with forecasting, pipeline analytics, and activity tracking
- Strong analytics capabilities beyond forecasting
- Best for: Data-driven organizations wanting combined forecasting and analytics
Selection Criteria for 2026
When evaluating CRM forecasting software, prioritize these capabilities:
Must-Have Capabilities:
- Probability weighting by stage with custom percentages
- Forecast categories (Pipeline, Best Case, Commit)
- Historical forecast vs. actual reporting
- Rep-level forecast accuracy tracking
- Mobile forecast submission
- Basic pipeline coverage calculations
High-Value Capabilities:
- Automated forecast snapshots (weekly captures for trend analysis)
- Multi-dimensional forecasting (by product, region, segment)
- Forecast collaboration (manager overrides with change tracking)
- Integration with revenue recognition systems
- Customizable forecast time periods (weekly, monthly, quarterly)
Advanced Capabilities (for mature orgs):
- AI/ML-powered probability scoring
- Deal risk scoring based on historical patterns
- Predictive close date recommendations
- Anomaly detection (deals behaving outside normal patterns)
- Scenario modeling (what-if analysis for different outcomes)
Integration Requirements:
- Bi-directional sync with ERP/financial systems
- Data warehouse connectivity for custom analysis
- BI tool integration (Tableau, Power BI, Looker)
- Sales engagement platform connectivity
- CPQ system integration for accurate deal values
Building a Forecast-First CRM Culture
Technology and methodology matter, but culture determines whether forecasting discipline sustains.
Make forecast accuracy visible. Create leaderboards showing forecast accuracy by rep, not just quota attainment. Celebrate the rep who forecasted within 2% as much as the one who hit 120% of quota.
Separate forecast conversations from performance management. Forecast reviews should focus on accuracy and learning, not judgment. If reps fear punishment for honest assessments, they’ll game the system.
Establish clear forecast definitions. Document exactly what belongs in “Commit” vs. “Best Case” vs. “Pipeline.” Ambiguity creates inconsistency.
Review forecast methodology quarterly. Markets change. Sales cycles evolve. Probability weights that worked last year may need recalibration.
Invest in data hygiene. Assign ownership for pipeline cleanliness. Run weekly audits. Make stale opportunity cleanup a management KPI.
Connect forecasting to resource planning. Show the organization how forecast accuracy enables better hiring decisions, marketing budget allocation, and capacity planning. When forecasting feels like bureaucratic overhead, it degrades.
Conclusion: Forecasting as Competitive Advantage
Sales forecasting in CRM isn’t about predicting the future with certainty—it’s about building systems that improve decision-making under uncertainty.
The organizations winning in 2026 treat forecasting as a core competency, not an administrative burden. They invest in CRM data architecture, calibrate their methodologies against actual performance, measure accuracy relentlessly, and build cultures where honest assessment is valued over optimistic projections.
The forecasting gap between leading and lagging organizations continues to widen. As AI and automation handle more routine tasks, the distinctly human capability to assess complex deals accurately becomes more valuable, not less.
Your CRM is only as good as the data you put in and the discipline you apply to forecasting. Start with the evaluation checklist in this guide. Implement one template. Track accuracy for one quarter. The compound returns of even modest improvements in forecast accuracy are substantial.
The question isn’t whether to improve your forecasting—it’s whether you’ll do it before your competitors.
About Pipeliner CRM: Pipeliner CRM provides visual, intuitive sales pipeline management and forecasting tools that help revenue teams improve accuracy without the complexity of enterprise systems. Learn more about intelligent forecasting at [pipeliner.com].