Much of the contentContent Content refers to a material or document released in various forms (such as text, image, audio, and video) and created to inform, engage or influence specific audiences. is taken from the ebook that you can download here, which is supplemented by other content such as videos, blog articles, and more.
All of this content will help you identify what types of data to analyze, and how to analyze it effectively so it delivers actionable insights.
“A point of view can be a dangerous luxury when substituted for insight and understanding.”
 Marshall McLuhan, Philosopher
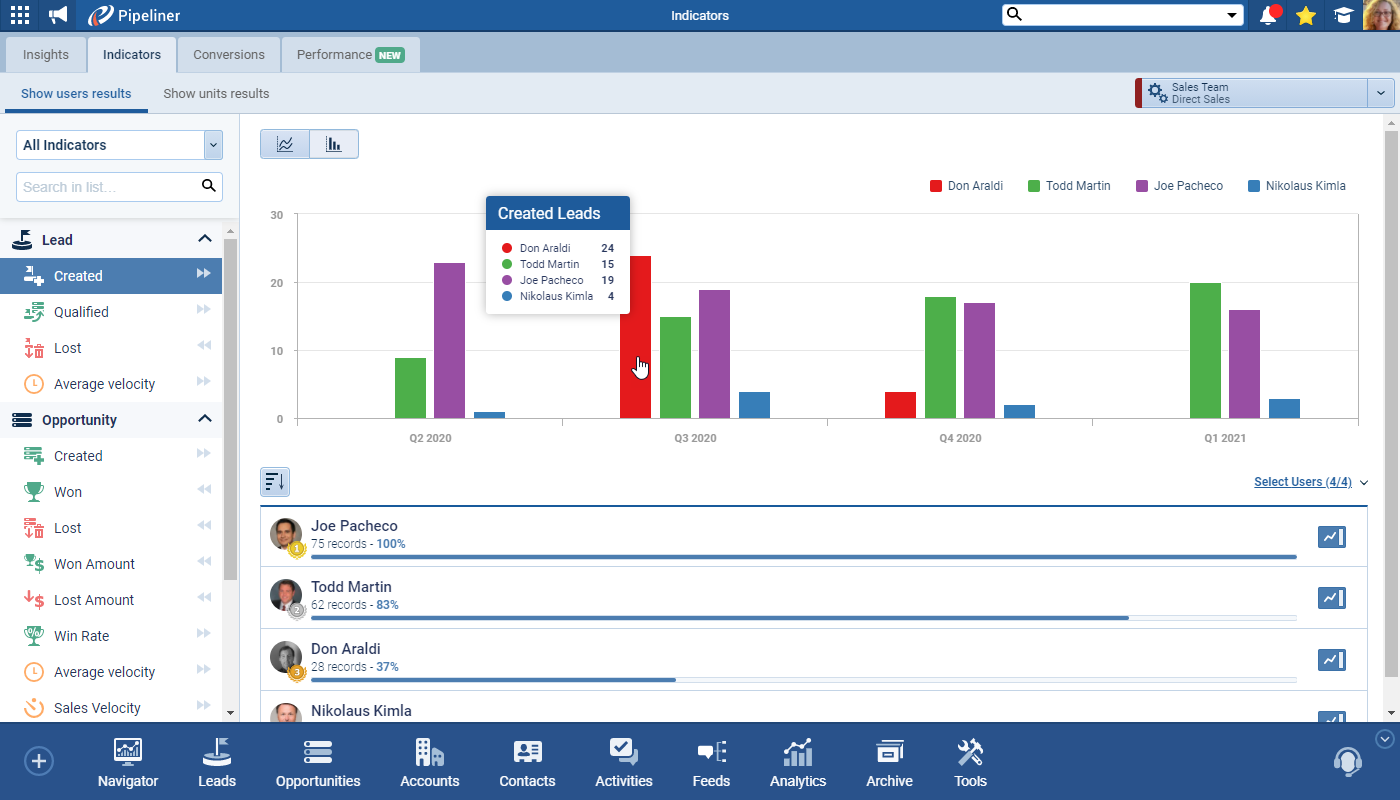
Pipeliner CRM Indicators Feature
The Indicators feature is unique to Pipeliner CRM & directly supports data accuracy.
Let’s start with some definitions:
Leading Indicators Definition

Leading Indicator Examples
New Appointments
# of Proposals Sent
# of Deals in PipelinePipeline Sales pipelineis a visual representation of the stage prospects are in the sales process.
Pipeline Value

Lagging Indicators Definition

Lagging Indicators Examples
# of units sold
Gross marginGross Margin Gross Margin refers to total sales minus the cost of goods sold (COGS). Median for true SaaS cos is 71%, but what are considered to be “good margins” varies in SaaS. If you are running a marketplace/transaction revenue business, be very clear about gross margin.
# of different products sold
Market share
Gross revenue

Key Indicators Examples…
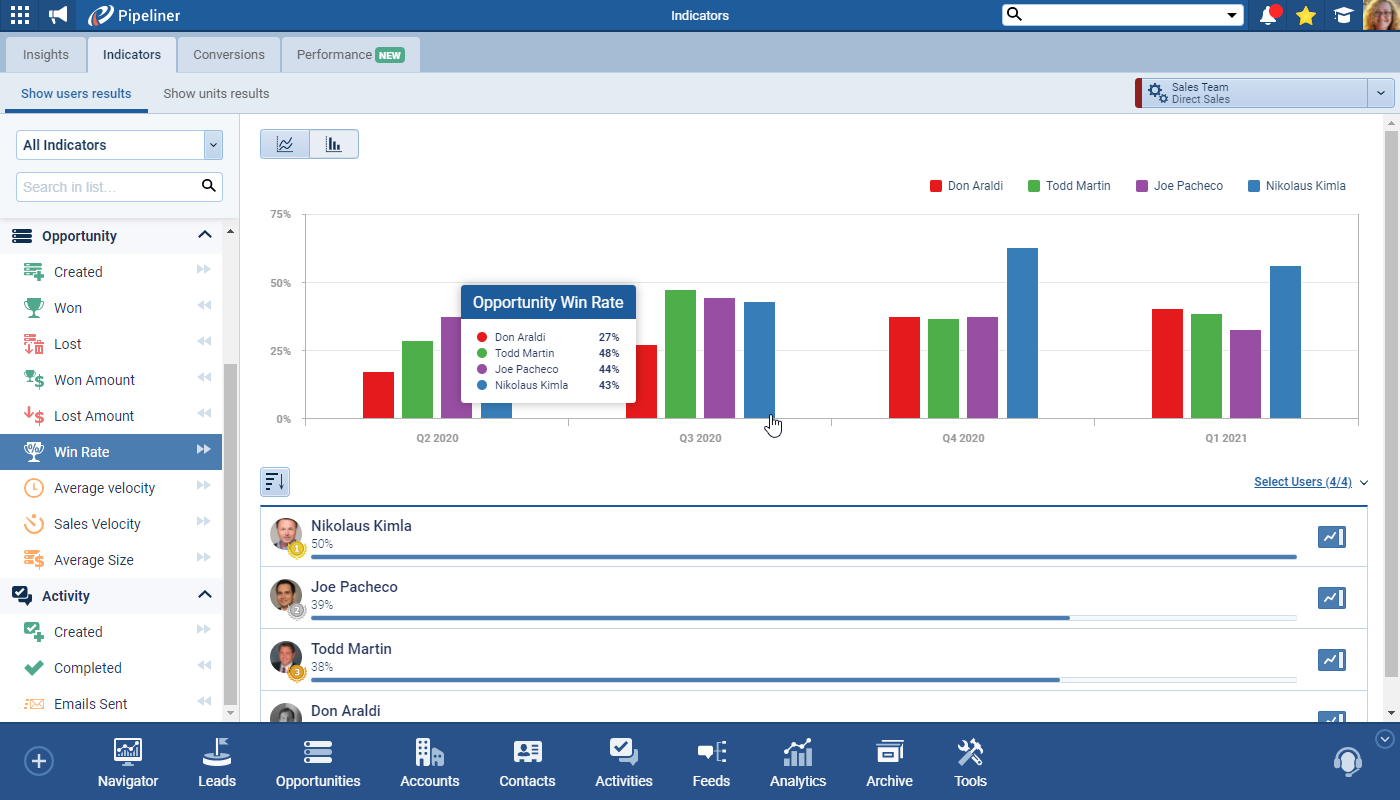
First, decide which salespeople you want to include. Then you can view leads created by quarterQuarter Quarter is a three-month period in a company’s fiscal year commonly used to make comparative performance analyses, detect or forecast business trends, report earnings, and pay shareholder dividends. with the numbers displayed and the salespeople colored-coded — plus you can click on an individual salesperson to review their particular stats.
With Pipeliner’s unique Power Panel you can create different views of the data, save them and even share them with others. Perhaps you have multiple sales units, different territories, or countries or different types of salespeople (inside vs. outside) — you can use the filter function to view them together, individually or in subsets.
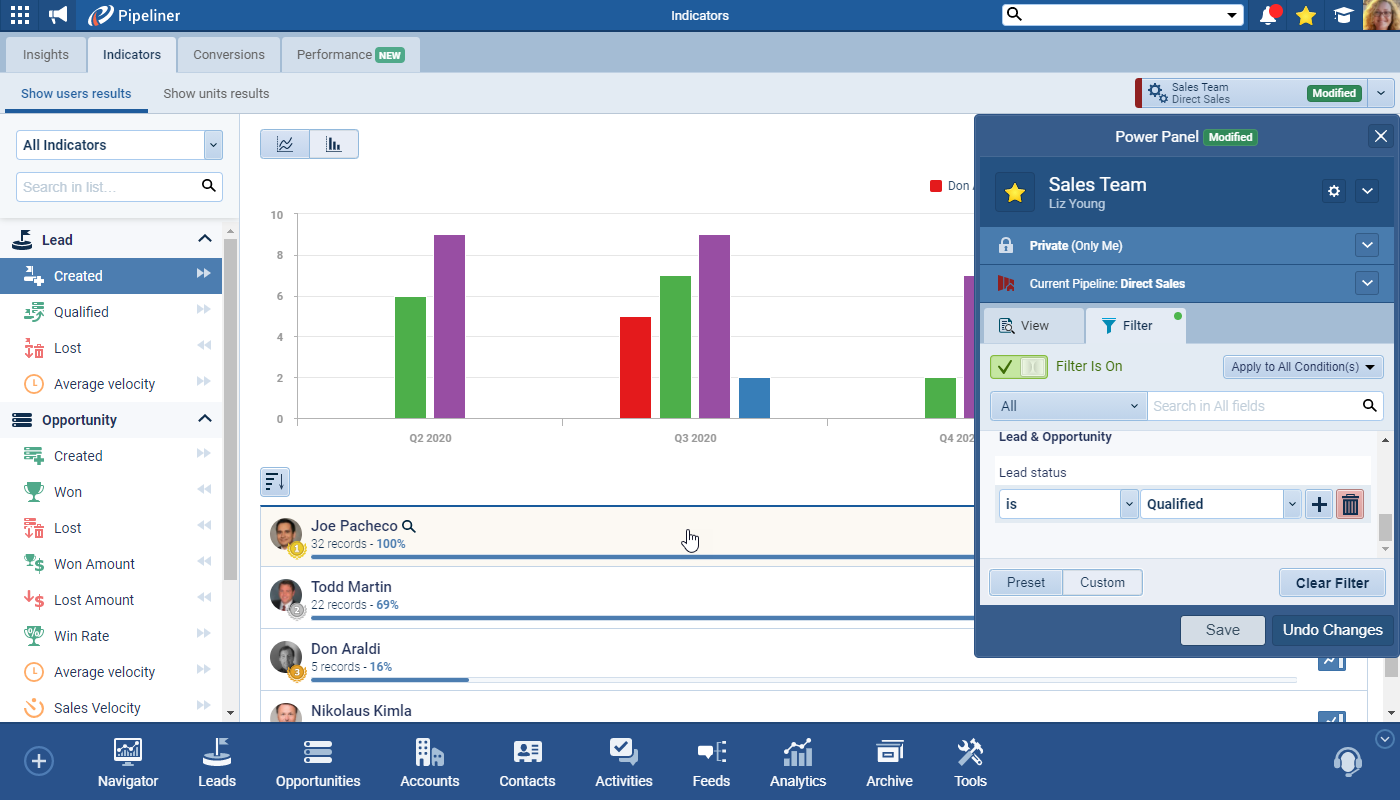
You can, for example, look at the average number of days spent on Opportunities in whatever timeframe you select (months, quarters, etc.). In addition, for example, you can see how many opportunities your teams or individual salespeople have created, won, or lost and even view the actual opportunity amount. Plus you can look at win rates, sales velocity, and average deal size.

Using this same functionality, you can review activities for teams or individuals (or even groups of individuals). You can look at them by type of activity, such as emails or calls, and see how many have been made in a certain period of time.
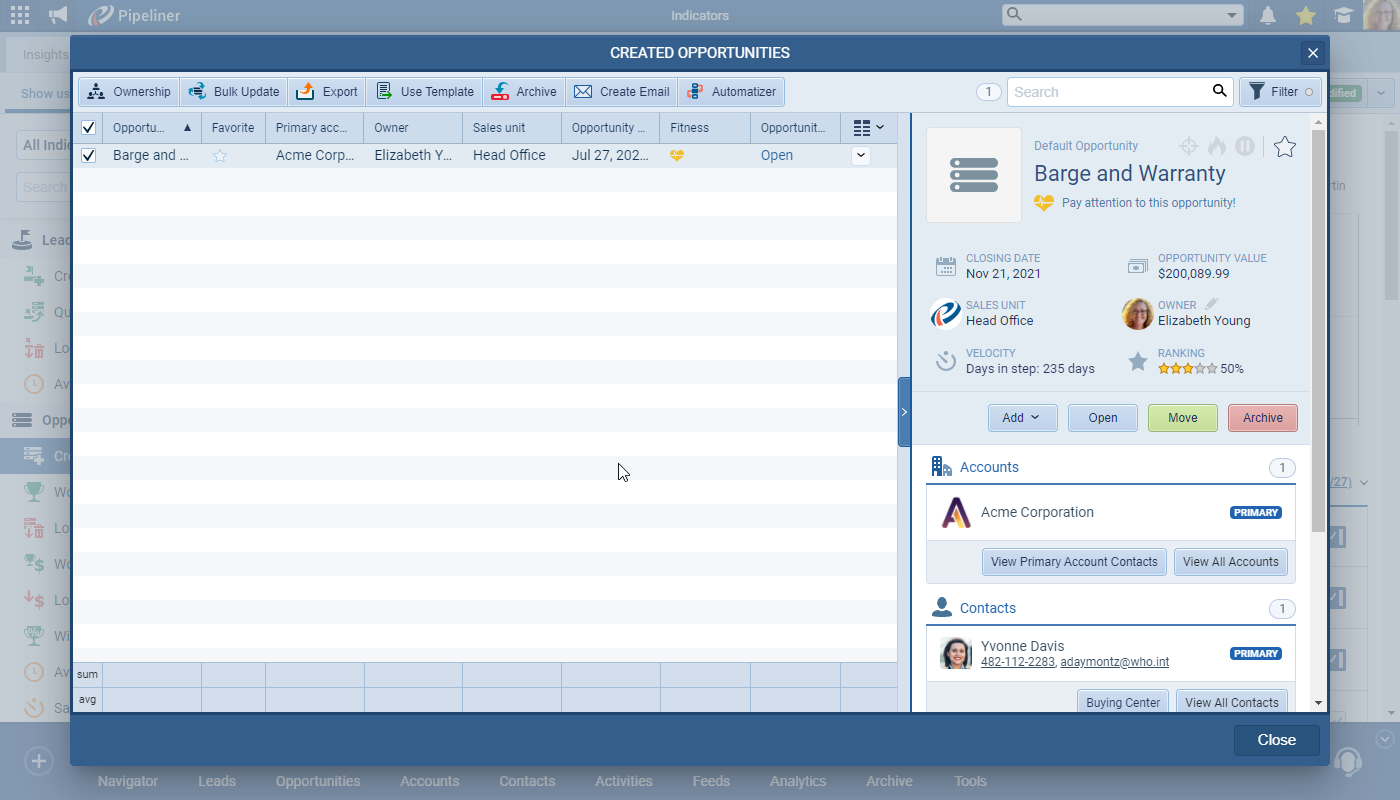
You have 3 broad entities you can visually analyze through the Indicator function: leads, opportunities, and activities. You can drill down all the way to an opportunity level and view everything in detail. No other CRM offers this level of functionality.
“84% of business leaders agree that making decisions quickly based on real-time data is increasingly important.”
 Data Issues Report, Harvard Business Review
“The Human brain can process entire images that the eye sees for as little as 13 milliseconds”