Intelligent QuotaQuota Quota is a predefined benchmark indicating the amount of sales a selling unit such as a sales rep or a regional sales team should achieve within a given period, often used as a measure of success, performance and eligibility for commissions and other rewards. Setting, Accurate ForecastingForecasting Forecasting is a prediction or calculation of a trend or event likely to occur in the future based on qualitative, quantitative and historical data as well as emergent but relevant factors. & Increased speed to close
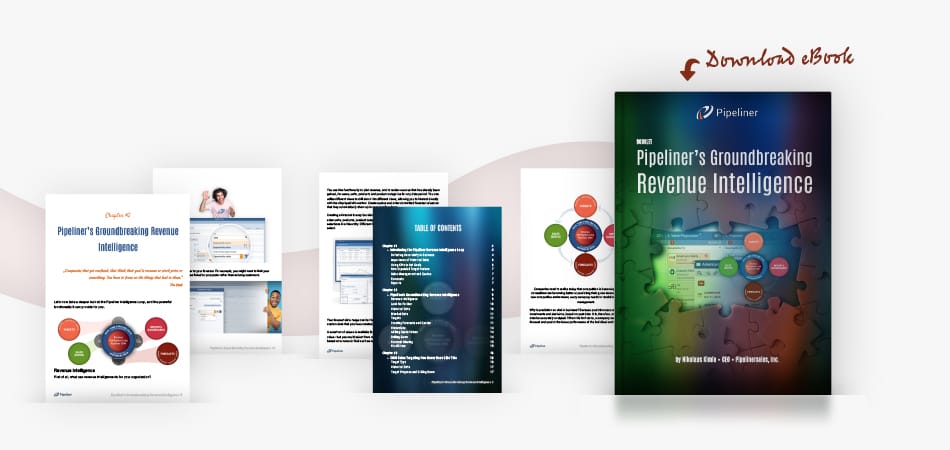
The Pipeliner Revenue Intelligence Loop delivers Predictable Revenue and Forecast Accuracy!
The Revenue Intelligence Loop enables you to
Set realistic quotas & targets using predictive analyticsPredictive Analytics Predictive Analytics refers to the field or tool that uses historical data, statistical models, emergent trends and other information to formulate an informed forecast about the future, usually with regards to the performance, growth, or feasibility of a business.
Forecast accurately with evidence-based revenue predictions
Instantly display a gap analysis to see what is needed to hit targets
Review pipelinePipeline Sales pipelineis a visual representation of the stage prospects are in the sales process. changes, trends, and risks in real-time
Track and manage sales rep efficiency throughout the buyerBuyer A buyer is an individual or organizational entity that purchases a product or subscribes to a service. journey
Directly connect activities to sales results (new business, upsell & retention)
Drill down into the dataData Data is a set of quantitative and qualitative facts that can be used as reference or inputs for computations, analyses, descriptions, predictions, reasoning and planning. to uncover pipeline insights at a granular level
Instantly share (or schedule) dynamic pipeline reports & dashboards
„The goal of forecasting is not to predict the future but to tell you what you need to know to take meaningful action in the present.“
 Paul Saffo • Author

Pipeliner is the first and only CRM that delivers evidence-based predictions, making it the only platform to truly deliver on the promise of CRM

The Importance of Historical Data
The more accurate the historical data, the more accurate the predictions
Historical data must include leading as well as lagging indicators for a holistic view
KPIs can include avg. deal size, sales velocity, targets, win rates, forecasts & performance insights

Newly Expanded Target Feature
Create userUser User means a person who uses or consumes a product or a service, usually a digital device or an online service. or group targets
Historical data is automatically filled in from KPIs
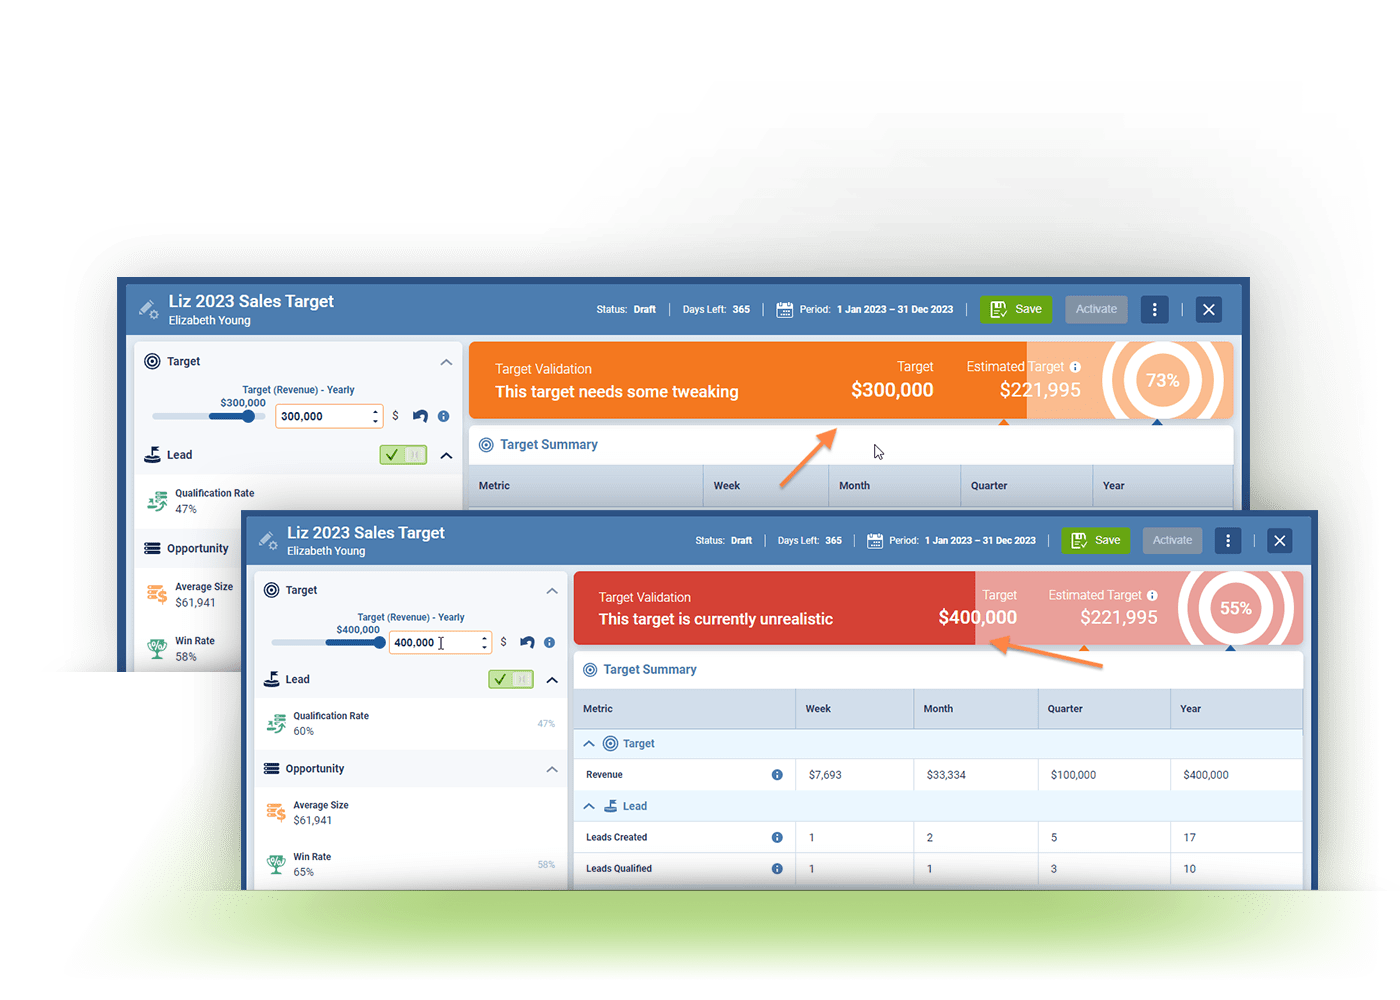
Using historical data, the target functionality assesses the target’s validity
How far away the individual or group is from achieving the target will always be visible during the sales cycleSales Cycle Sales Cycle is a repeating process characterized by a predictable sequence of stages that a company undergoes as it sells its products and services to customers.

Sales Management & Quotas
Set & assign precise quotas for individuals, teams, territories (or however you are structured)
Once quotas are set, realistic forecasts can be created & adjusted during the period for accuracy
Robust reporting empowers sales management with dashboards and advanced analyticsAnalytics Analytics is the active study of different types of data with the aim of discovering meaningful patterns and translating these into insight (such as historical analyses and forecasts), or action (such as those intended to improve business performance).
First CRM to include evidence-based prediction capability
Say goodbye to guesswork or hunches and hello to intelligent CRM
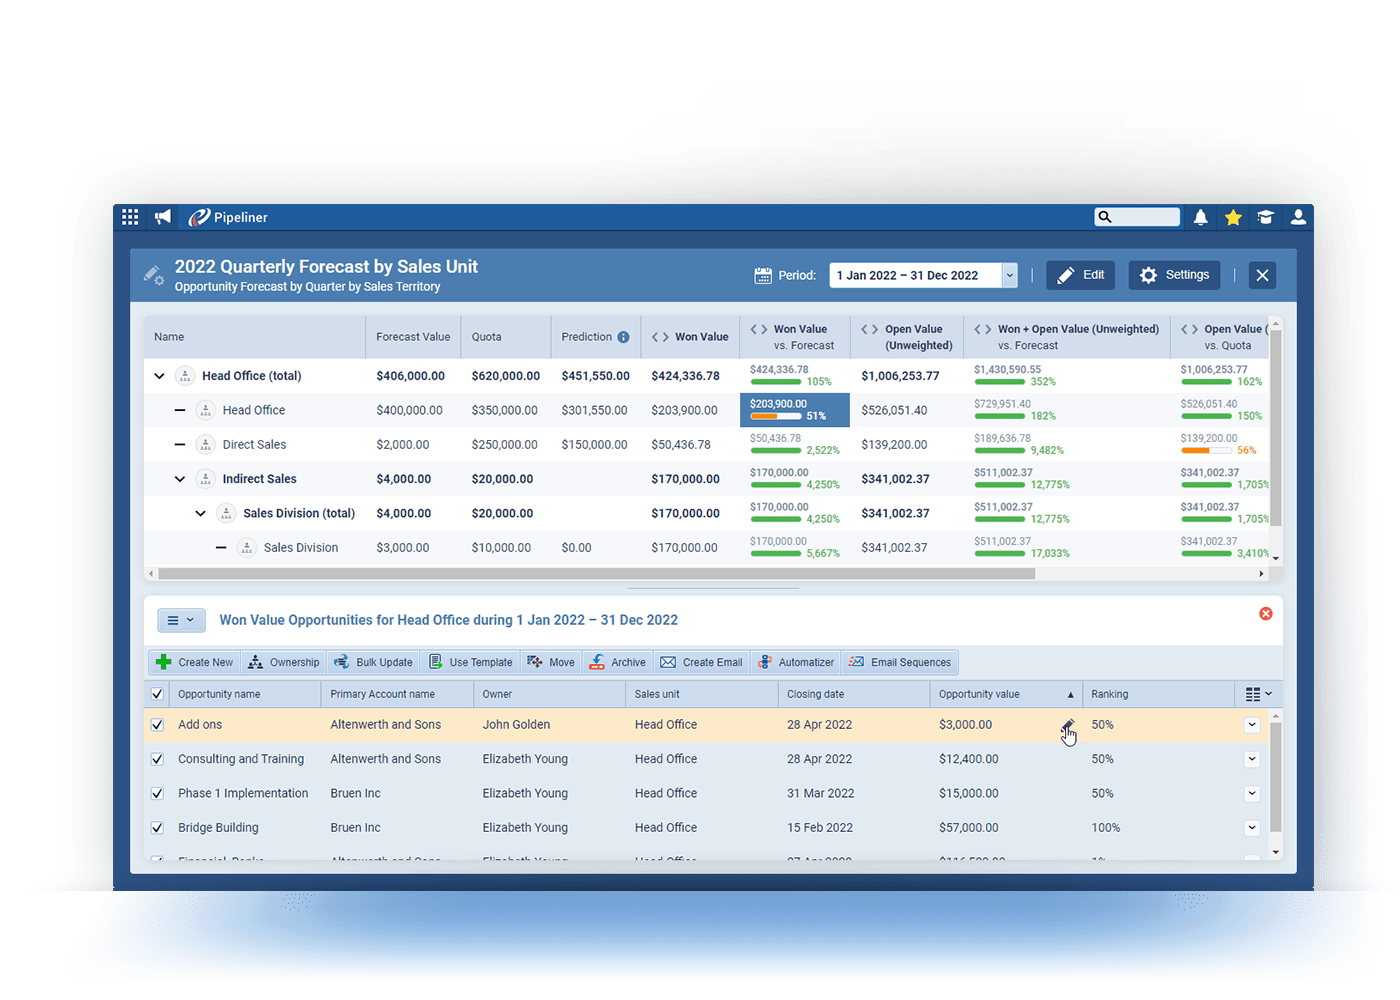

The goal of forecasting is not to predict the future but to tell you what you need to know to take meaningful action in the present.
Creating Forecasts & Quotas
The path to predictable revenue
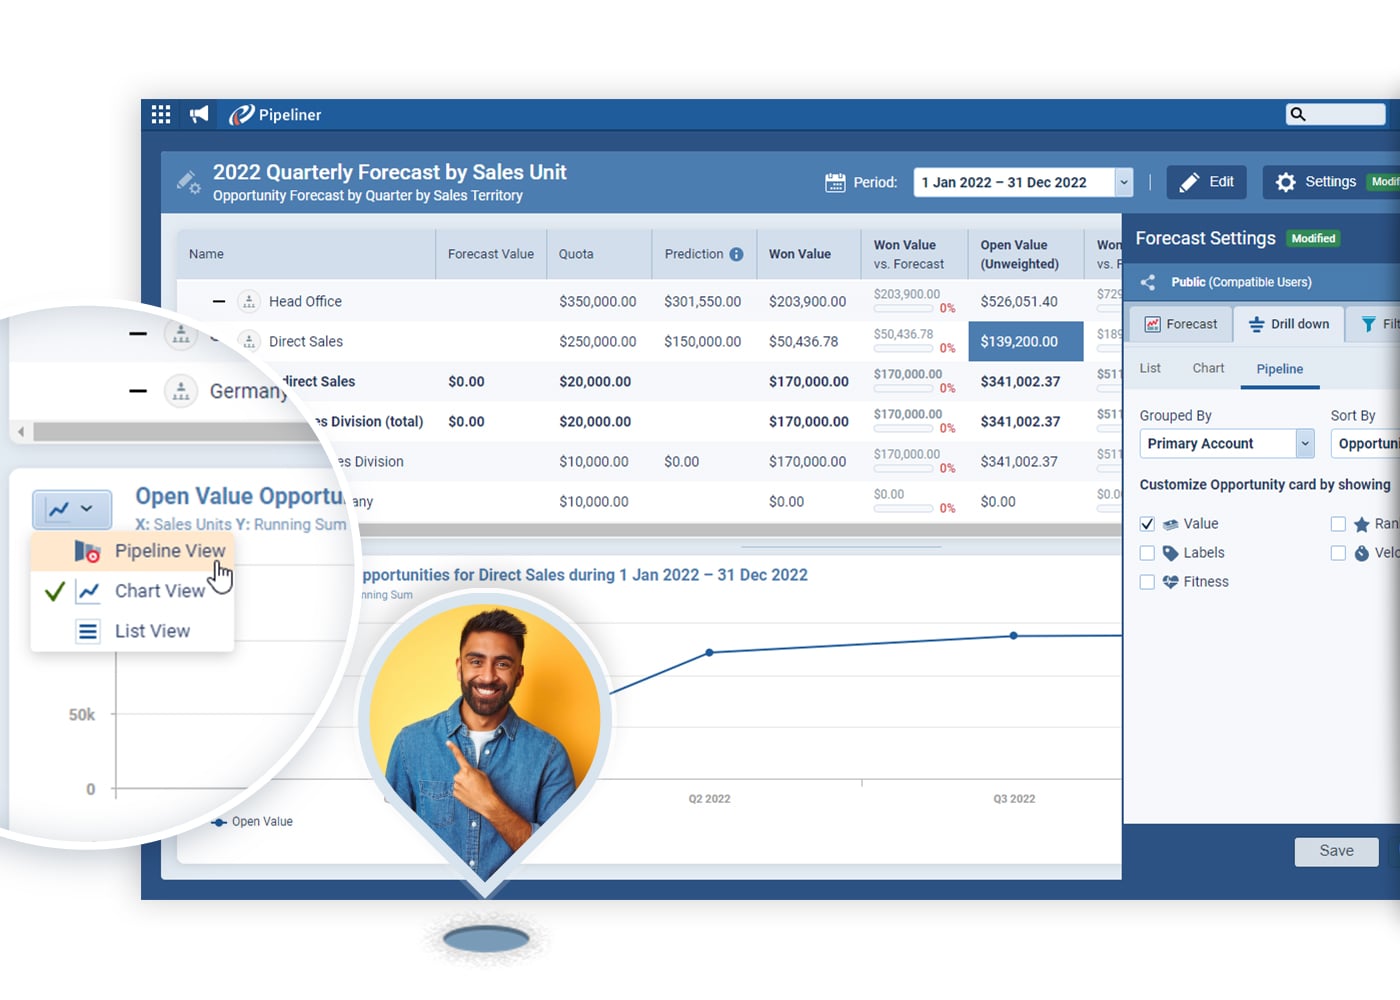
Forecast Flexibility: users, sales units, products, productProduct Product refers to anything (an idea, item, service, process or information) that meets a need or a desire and is offered to a market, usually but not always at a price. categories, and accounts
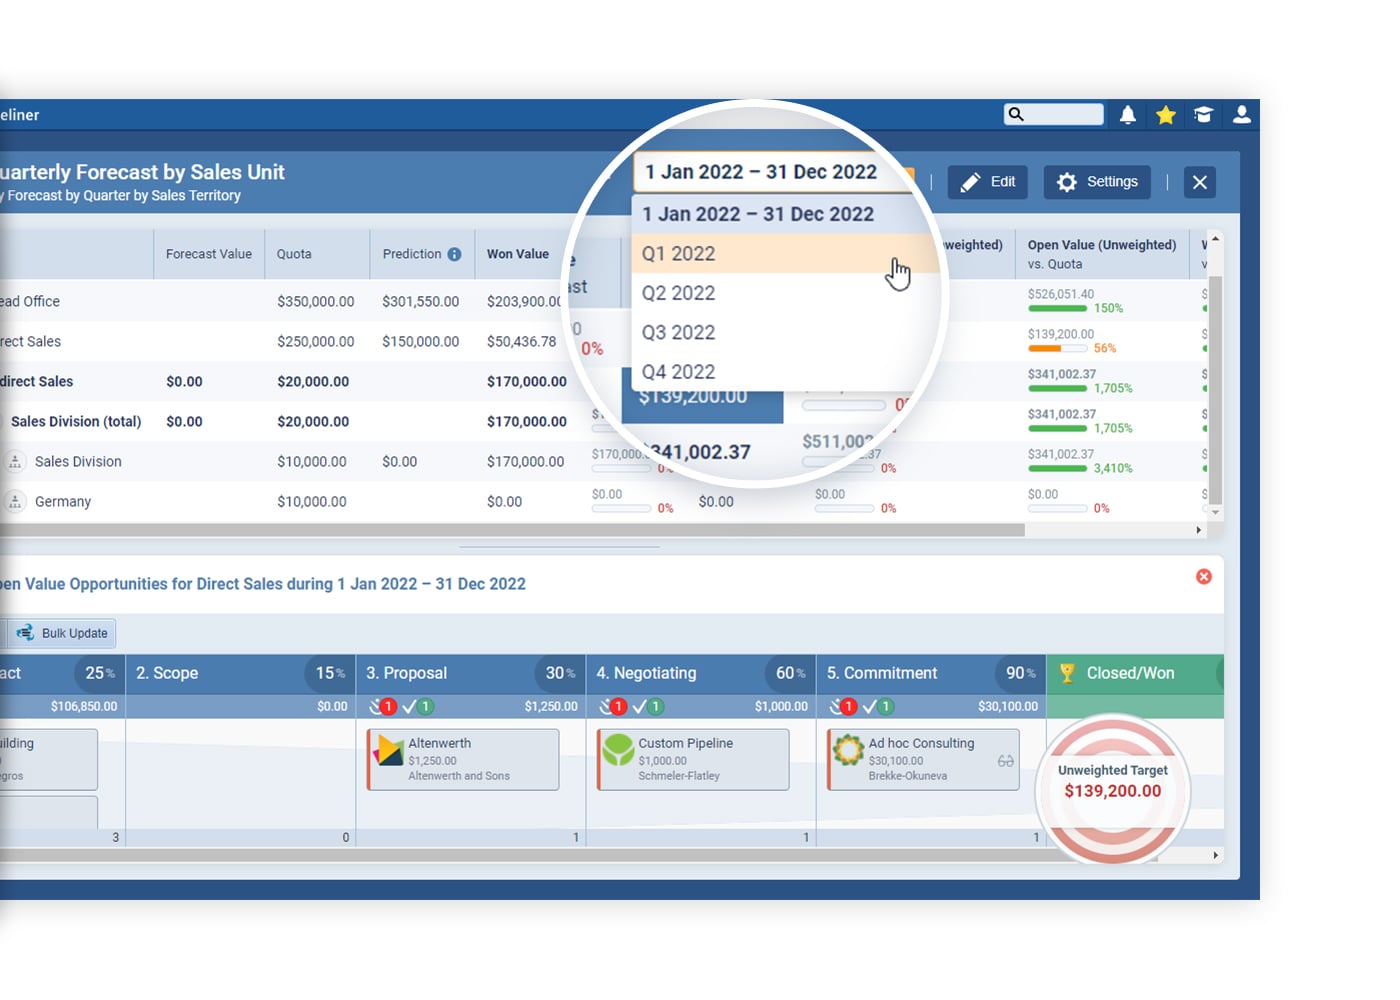
Date Range Flexibility: e.g. Closing Date or any Custom date range
Forecast Value Flexibility: The default is Opportunity Value but you can use many others such as value (currency), count (or sum)
Forecast View Flexibility: e.g. you can limit the forecast to new opportunities and use the filter functionality to filter out existing customers
Five levels of hierarchies for forecast roll-up (e.g. user to sales unit)
Add quota values to your forecast with maximum flexibility (e.g. even split or based on historical performance)
You can easily drill down and customize what data is displayed (even edit data as you drill down)
Select who you want to share the forecast with (individuals, teams, etc.)

Pipeliner’s revenue intelligence provides all the powerful functionality you would expect from a full CRM application—without costly and complex add-ons. It’s all here, right out of the box.
More About Targets
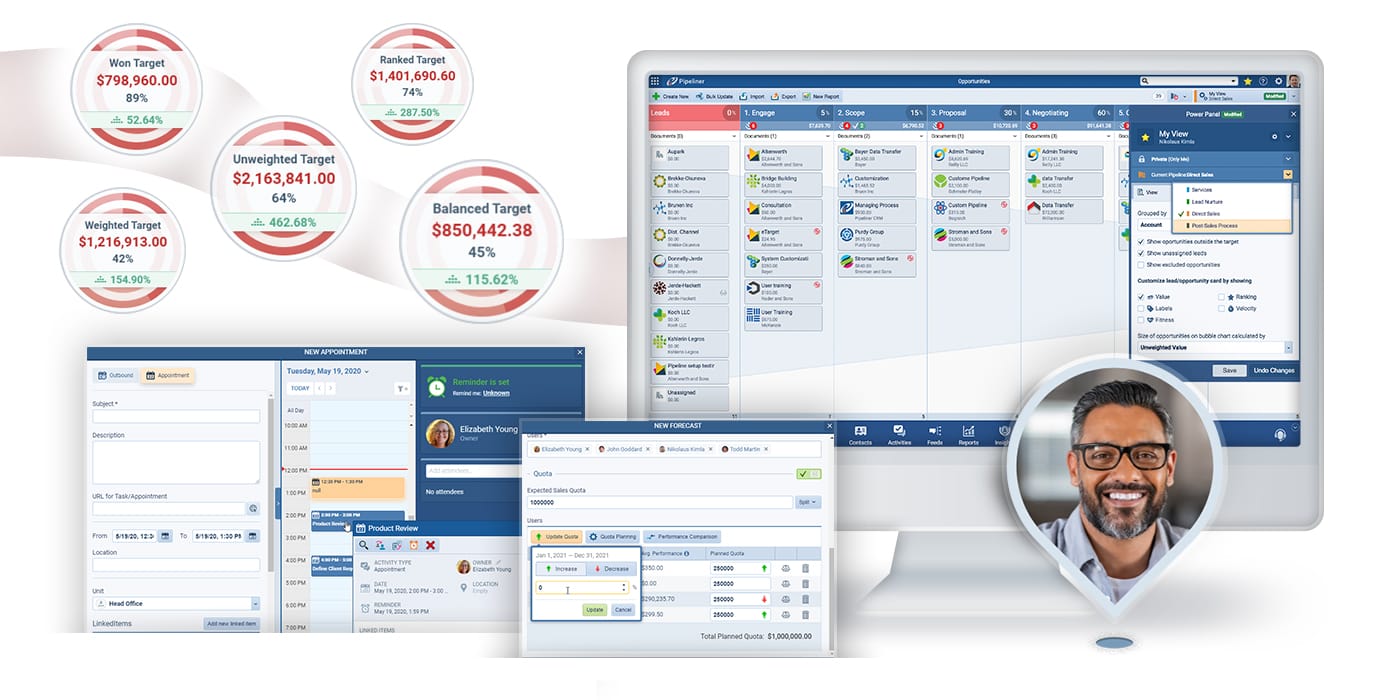
Sales Target Setup
Choose Target Type (revenue, leads created, leads qualified, etc.)
Filter exactly what type of sales (e.g. new, recurring or upsell)
Choose a time period (week, month, quarterQuarter Quarter is a three-month period in a company’s fiscal year commonly used to make comparative performance analyses, detect or forecast business trends, report earnings, and pay shareholder dividends., year)
Once Target is named, Pipeliner populates with historical data
The system now informs you as to whether the Target is attainable
Many different historical data points can be utilized, for example:
- rep working hours (e.g. full-time/part-time)
- leadLead Lead refers to a prospect or potential customer (who can be an individual or organization) that exhibits interest in your service or product; or any additional information about such entity. conversionConversion Conversion is the process of turning a target consumer into a paying customer; or more generally, the point at which a user performs a specific action favorable to a marketer or a seller. rates
- average opportunity value
- sales velocity
Sales Target Progress
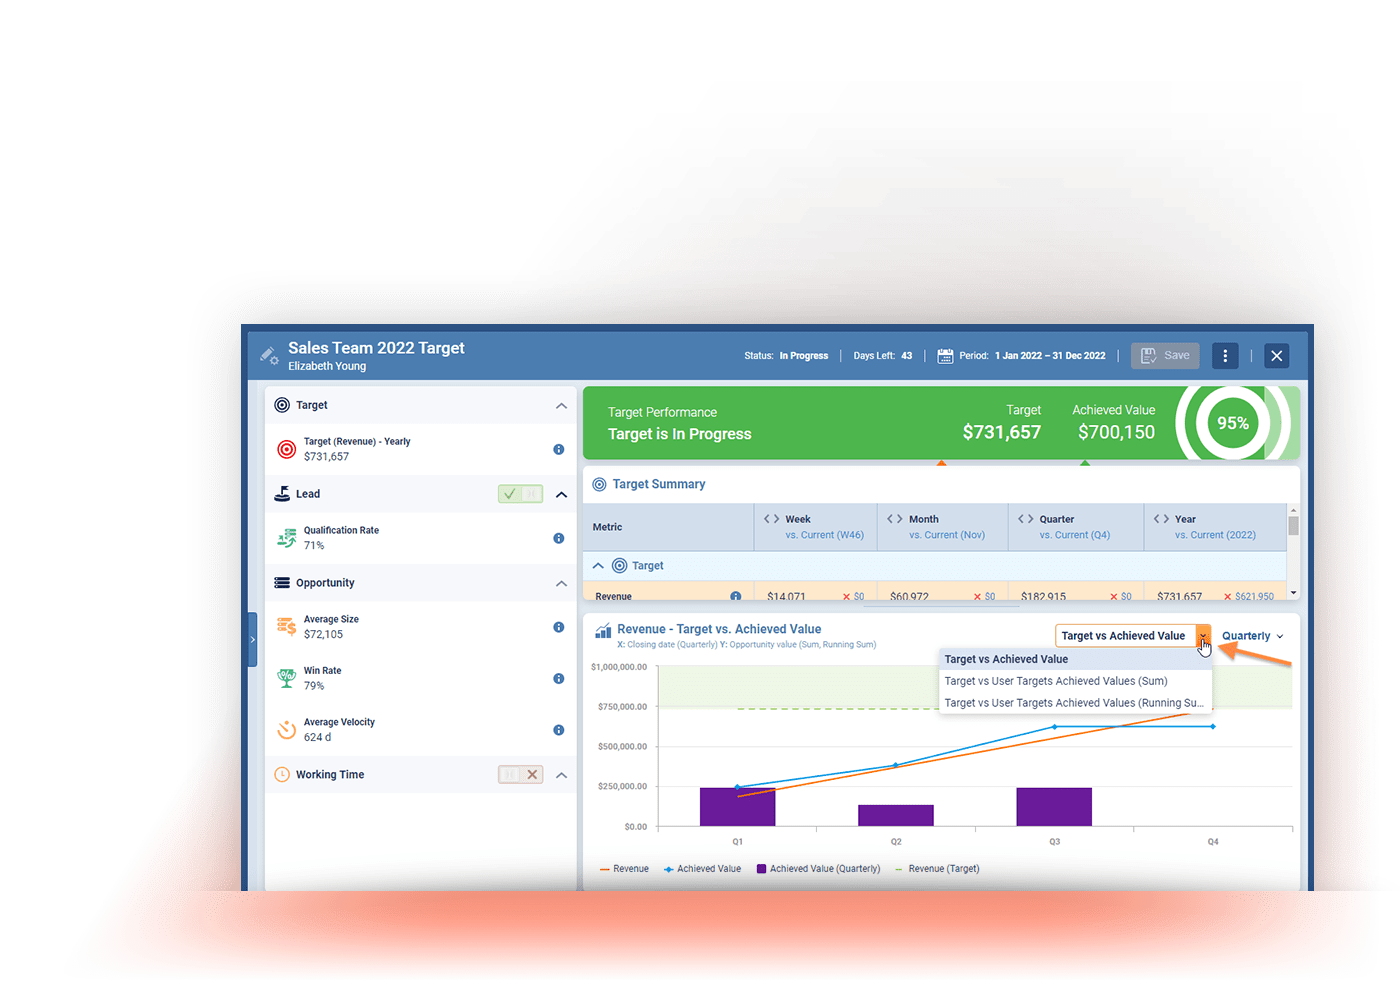
Once activated the Target can be dynamically tracked
For example, the system will tell you how many more leads you need to reach the Target
A dynamic, visual graph shows revenue needed vs. revenue achieved & overall target performance
Target shows the value of opportunities currently in the pipeline
Drill-down into individual opportunities for total transparency

Much of the robust functionality you will find in Pipeliner is not included in other out-of-the-box CRMs.
Additional Resources
Learn More About Pipeliner CRM
Take a no-obligation 14 day trial of Pipeliner CRM.
No credit card info required – just experience for yourself how it could impact your sales.

