January 12th, 2026
AI Automatizer
Revolutionize your CRM with Pipeliner CRM AI Automatizer. Use natural language to instantly build, refine, and deploy complex workflows. Speed up automation with AI precision and total human control.
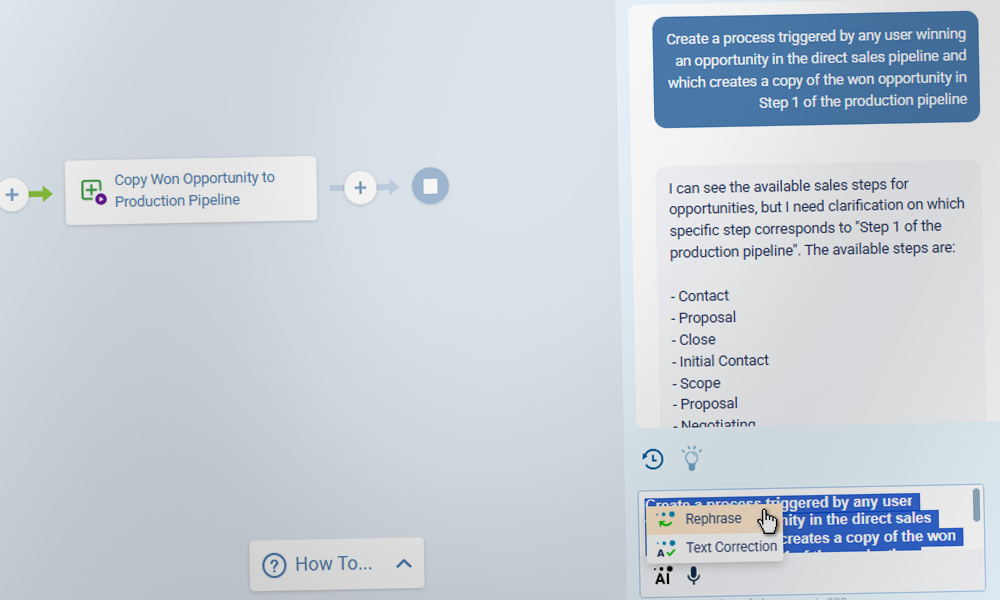
Revolutionize your CRM with Pipeliner CRM AI Automatizer. Use natural language to instantly build, refine, and deploy complex workflows. Speed up automation with AI precision and total human control.
Turn every meeting into intelligence with Pipeliner CRM. Automatically transcribe and summarize video or audio files into actionable insights with Voyager AI. Stop note-taking and start selling.
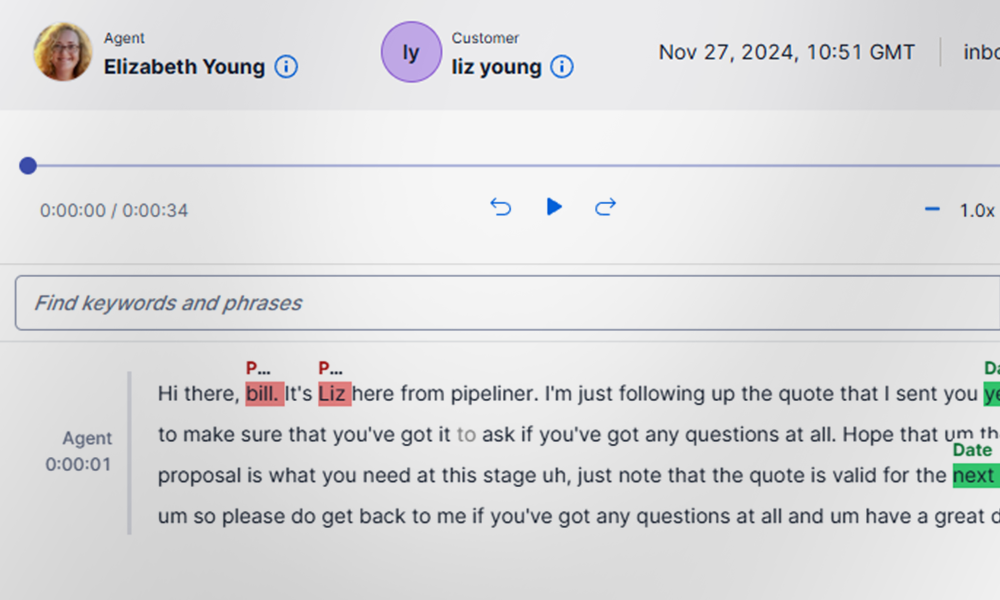
Maximize ROI with Pipeliner CRM AI. Automate call transcription and summaries with Voyager AI to eliminate manual data entry, boost sales productivity, and uncover actionable customer insights.
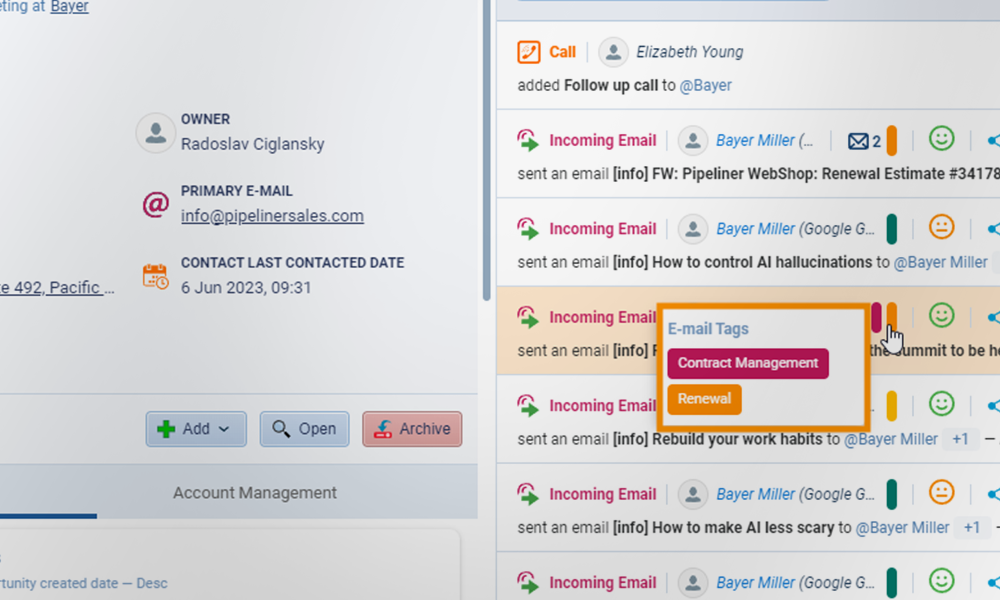
Transform email noise into sales intelligence. Pipeliner CRM’s Voyager AI categorizes messages and analyzes sentiment automatically, helping you prioritize high-value deals and at-risk accounts.
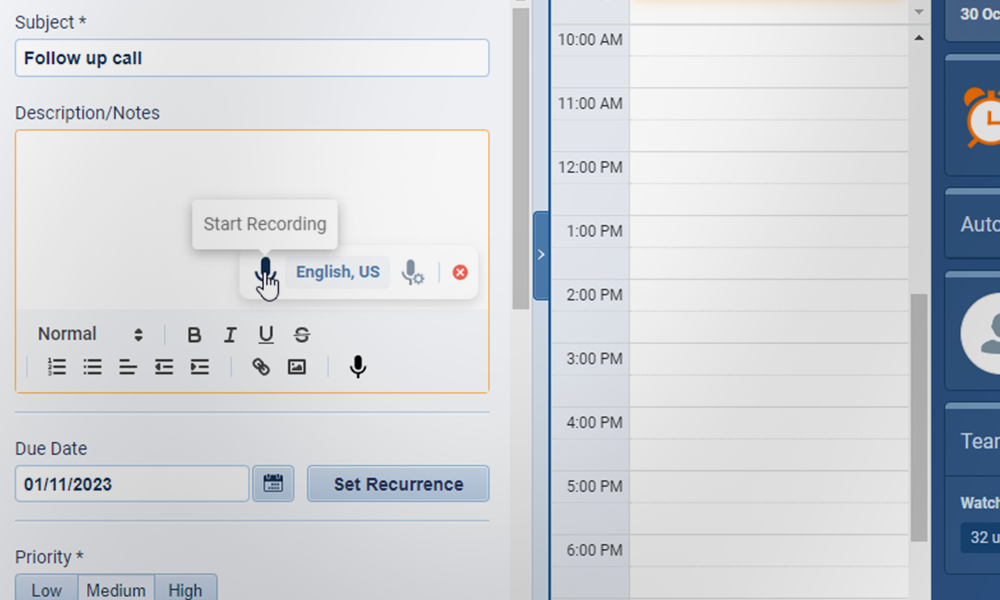
Maximize productivity with Pipeliner CRM’s AI Speech. Reclaim hours by instantly transcribing notes and emails, using AI to refine content for total data accuracy and seamless sales workflows.
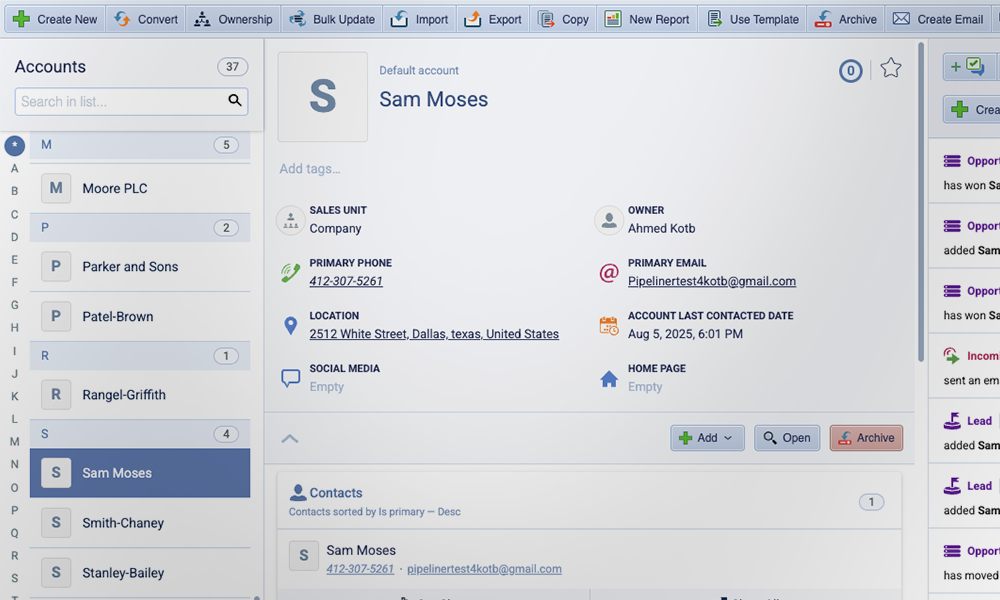
Stop hunting for data. Pipeliner CRM’s Compact View consolidates leads, accounts, and history into one interactive screen. Eliminate clicking, see the full story instantly, and close deals faster.
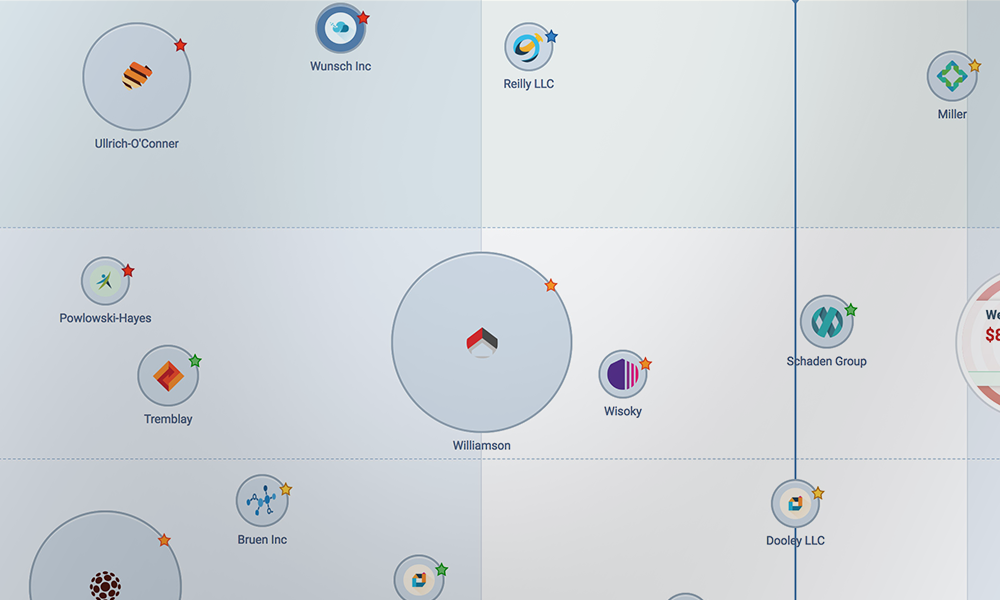
Stop staring at rows! Pipeliner CRM's Bubble Chart View instantly transforms your pipeline into a visual landscape. Value, stage, and close date, all at a glance.

Pipeliner CRM's Map View transforms your data into an interactive geographic visualization. Instantly see where your revenue lives—and where high-value opportunities are hiding. Beyond lists, beyond charts.
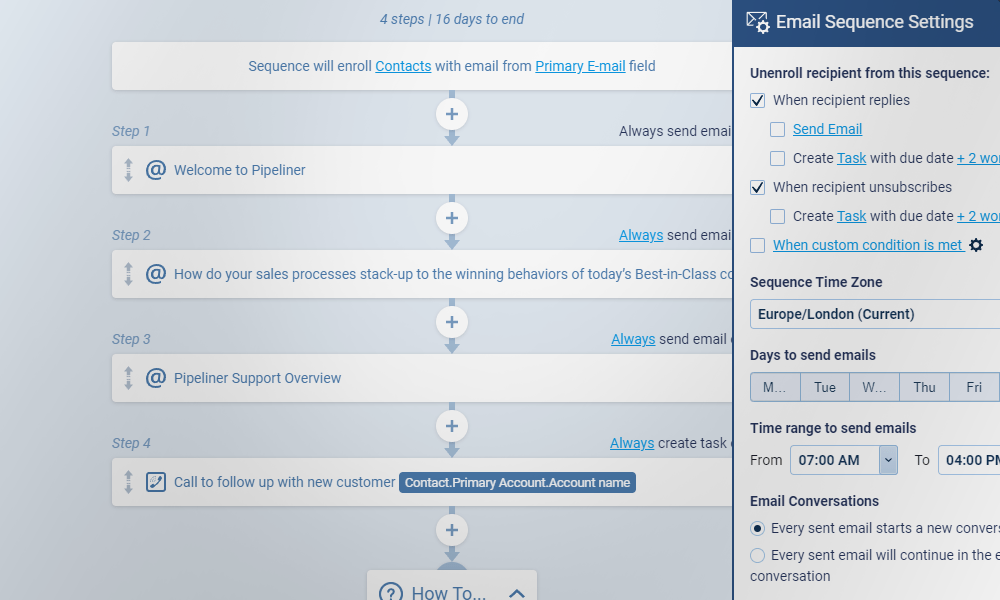
Tired of lost leads? Pipeliner CRM Email Sequencing automates personalized nurture campaigns right inside your CRM. Eliminate manual follow-up, ensure perfect timing, and protect your sales reputation with "smart" sequences.