Pipeliner CRM ForecastingForecasting Forecasting is a prediction or calculation of a trend or event likely to occur in the future based on qualitative, quantitative and historical data as well as emergent but relevant factors. enables companies to increase forecast accuracy and minimize risk
Why is Forecasting Important?
Accurate forecasting brings focus…
…focus brings efficiency › efficiency brings Productivity!

“Fewer than 20% of sales organizations have forecast accuracy of 75% or greater.”
 Miller Heimann
Unmatched Date Range Flexibility
For example › Set different forecasting date ranges for…
Different teams
Individual salespeople
Different productProduct Product refers to anything (an idea, item, service, process or information) that meets a need or a desire and is offered to a market, usually but not always at a price. lines
Different product categories

All the Forecasting options you need
Even more ways to forecast…
Different sales processes
Types of sales (new vs. upsell)
Select which fields you want to include in the forecast
Flexibility
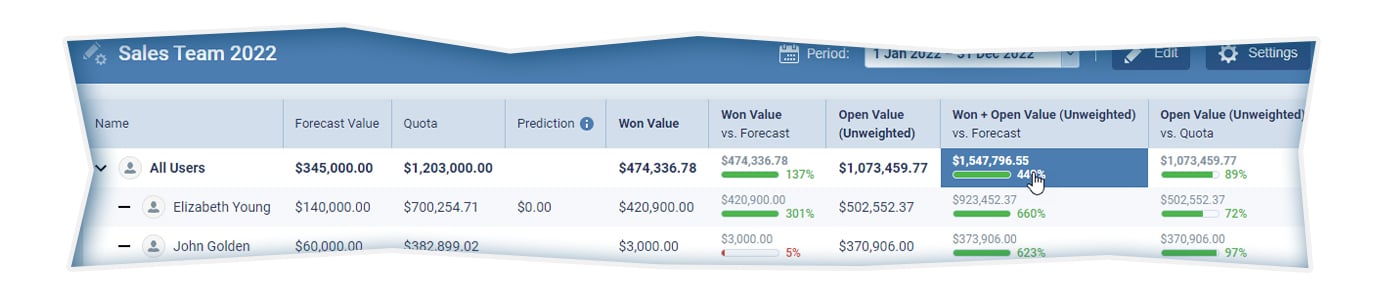
Setting Quotas: Misset quotas often leads to missed forecasts. Pipeliner Forecasting does away with such inaccuracy.
For example, if the yearly quotaQuota Quota is a predefined benchmark indicating the amount of sales a selling unit such as a sales rep or a regional sales team should achieve within a given period, often used as a measure of success, performance and eligibility for commissions and other rewards. is $3 million to be split between two sales reps, you could divide the quota evenly, which would come out to $1.5 million per rep.
But as any sales manager knows, reps don’t all produce at the same rate. Therefore, you can divide the quota based on the historical average performance of each rep. (You then might have one rep quota set at $2,267,074.46, and the other at $732,925.54, to add up to the $3 million quota).
Since this is a yearly quota, Pipeliner’s forecasting feature will divide the quota per rep up into 12 months, based on past average performance also—this time, per month.
Plus you can use other performance metricsMetrics Metrics are quantities that are measured and used to: such as Ranking to forecast.

PipelinePipeline Sales pipelineis a visual representation of the stage prospects are in the sales process. View, Chart View and List View
There are even more ways to evaluate past performance dataData Data is a set of quantitative and qualitative facts that can be used as reference or inputs for computations, analyses, descriptions, predictions, reasoning and planning.

You can select specific users, or all users, and instantly create a line chart showing their performance month-by-month, or by any time period, you choose.
The chart can be by the sum for the period of time, or running sum which incrementally adds the later period’s total to the last.
If you want to drill down into a particular period, simply click on it and view the specific deals adding up to that period.
Or, you can create a list view of the deals that add up to this amount and select any particular columns you want to see.

Uniquely among CRMs, Pipeliner also offers the “Pipeline View” of these deals. This shows where exactly they fall in the particular stages of the pipeline. This can also be done by a single rep, a group, or all.
Finally, you can also visualize your data in the list view. Within a chart, you can filter to see only particular types of deals, products, sales, or any other qualifier you specify.
Pipeliner is the only CRM that gives you the functionality for –
“Instant dynamic visualization through collaborative forecasting!”