Voyager has arrived—empowering you with the very first Artificial Intelligence functionality for Mobile CRM.

It’s one thing to have statistics and numbers. But to interpret statistics requires intelligence, which is what we are providing with Voyager.
- Want to know how well you or your team are doing compared to last sales period?
- Want to see how you or your team have improved or are suffering with regard to opportunities? LeadLead Lead refers to a prospect or potential customer (who can be an individual or organization) that exhibits interest in your service or product; or any additional information about such entity. count?
- Or accounts and contacts?
It’s all here—brought to you by Voyager AI, utilizing Pipeliner’s instant dynamic visualization.
How it Works
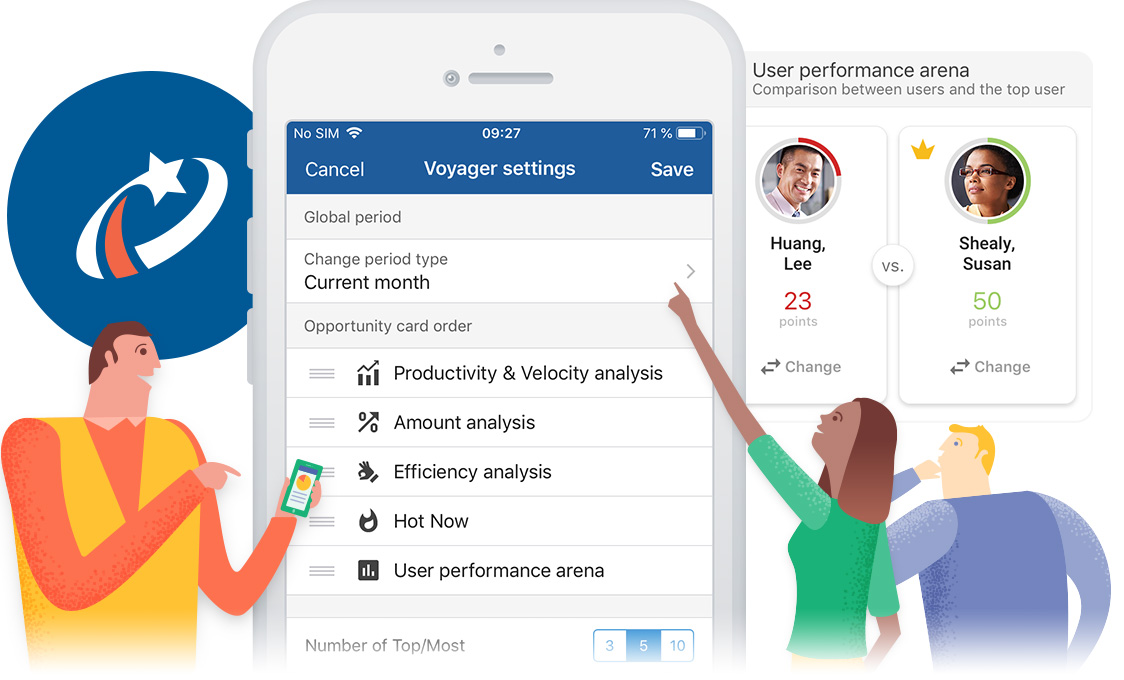
Let’s start with opportunities, since that’s usually the first thing salespeople and sales leaders want to know about. Voyager offers you four powerful views of opportunities:
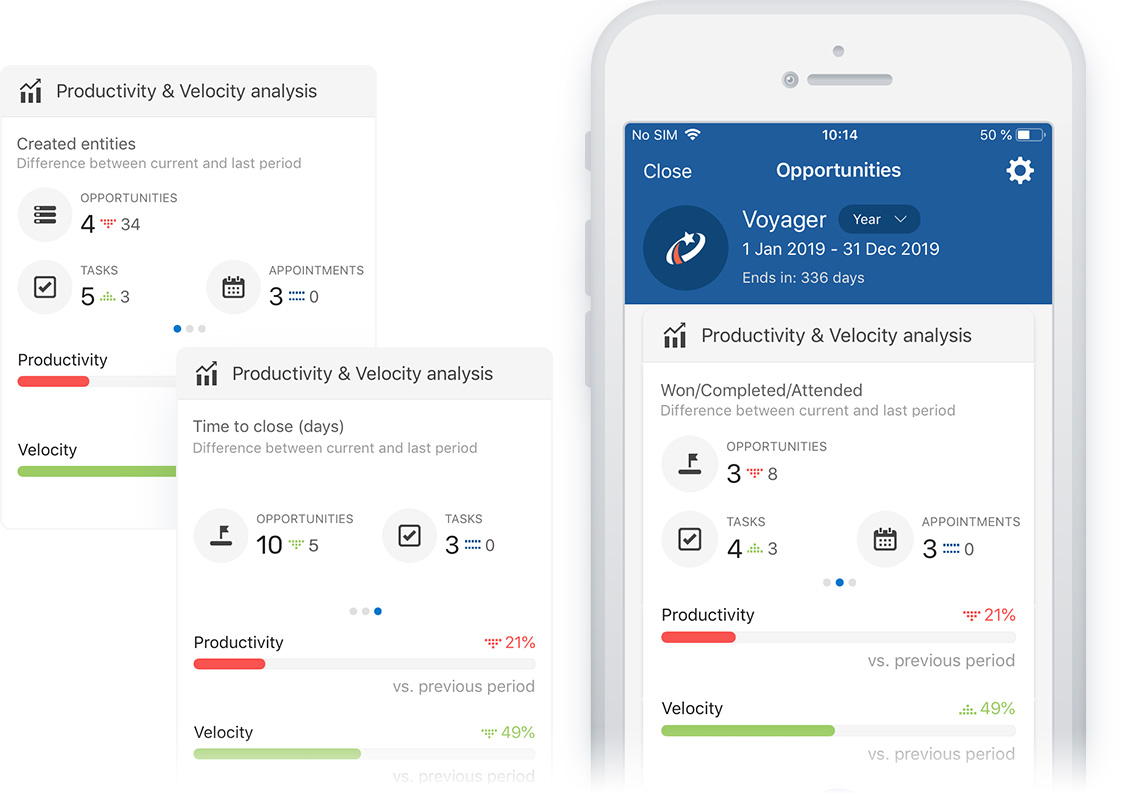
![]() Productivity—Shows you a comparison, as a ratio, of the current number of opportunities that have been won, as compared with the previous period, for a salesperson or team.
Productivity—Shows you a comparison, as a ratio, of the current number of opportunities that have been won, as compared with the previous period, for a salesperson or team.
![]() Velocity—Shows the speed at which a salesperson or team is winning opportunities, as compared with the previous period.
Velocity—Shows the speed at which a salesperson or team is winning opportunities, as compared with the previous period.
![]() Winning Percentage—This metric compares a salesperson’s or sales team’s revenueRevenue Revenue is the amount of money a business generates during a specific period such as a year or a quarter; also called sales. from opportunities to the previous period.
Winning Percentage—This metric compares a salesperson’s or sales team’s revenueRevenue Revenue is the amount of money a business generates during a specific period such as a year or a quarter; also called sales. from opportunities to the previous period.
![]() Efficiency—Shows how efficient a salesperson or team is, as compared to the previous period.
Efficiency—Shows how efficient a salesperson or team is, as compared to the previous period.
Each of these metricsMetrics Metrics are quantities that are measured and used to: are color-coded so you can instantly see how each is performing, and rapidly take needed action:
Red = Negative
Green = Positive
Blue = Stable
You can view the “quick status” for opportunities, which gives you an instant, color-coded graphic of the above dataData Data is a set of quantitative and qualitative facts that can be used as reference or inputs for computations, analyses, descriptions, predictions, reasoning and planning..
Analysis
From these views you can “drill down” to gain more granular insights.
- From both Productivity and Velocity, drill down to the Productivity and Velocity Analysis, where you can see the number of opportunities, tasks and appointments created within a time period, and view instant comparisons to the last sales cycleSales Cycle Sales Cycle is a repeating process characterized by a predictable sequence of stages that a company undergoes as it sells its products and services to customers..
- From Winning Percentage, drill down to the Amount Analysis, which shows both won amount and lost amount in revenue, and compares to the previous sales cycle.
- From Efficiency, drill down to the Efficiency Analysis, which shows you, in comparison to the last sales period, the degree of efficiency in relationship to tasks and appointments.
Each of these analyses provide several different graphical methods with which to view the data.


UserUser User means a person who uses or consumes a product or a service, usually a digital device or an online service. Comparison Arena
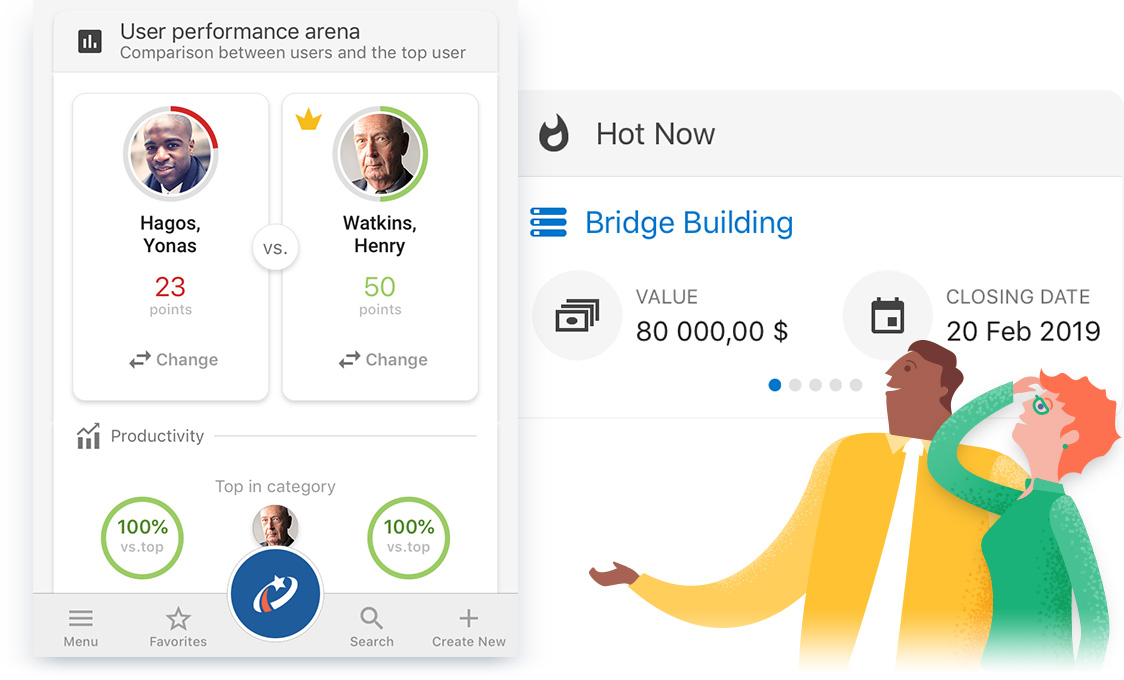
This totally unique feature allows you to compare user performance, one with another.
Hot Now
For opportunities, you also have a “Hot Now” window which shows your hottest deals and their close dates. Know where to put your priorities.
Leads
Leads are the lifeblood of any sales organizationOrganization Organization is a cohesive group of people working together and formally bound by a shared identity (e.g., one team, company, club, etc.) and a common purpose (e.g., business growth, athletic victory, etc.)., for without them, opportunities never happen. For leads, Voyager AI guides you with three views:
![]() Productivity—Shows you a comparison, as a ratio, of the current number of opportunities that have been won, as compared with the previous period, for a salesperson or team.
Productivity—Shows you a comparison, as a ratio, of the current number of opportunities that have been won, as compared with the previous period, for a salesperson or team.
![]() Velocity—Shows the speed at which a salesperson or team is winning opportunities, as compared with the previous period.
Velocity—Shows the speed at which a salesperson or team is winning opportunities, as compared with the previous period.
![]() Efficiency—Shows how efficient a salesperson or team is, as compared to the previous period.
Efficiency—Shows how efficient a salesperson or team is, as compared to the previous period.
For leads, the “quick status” allows you to view these three metrics all on one screen, color coded for instant comprehension.
As with opportunities, you can drill down into analyses from each of these metrics for a more granular look at the data.

Accounts & Contacts
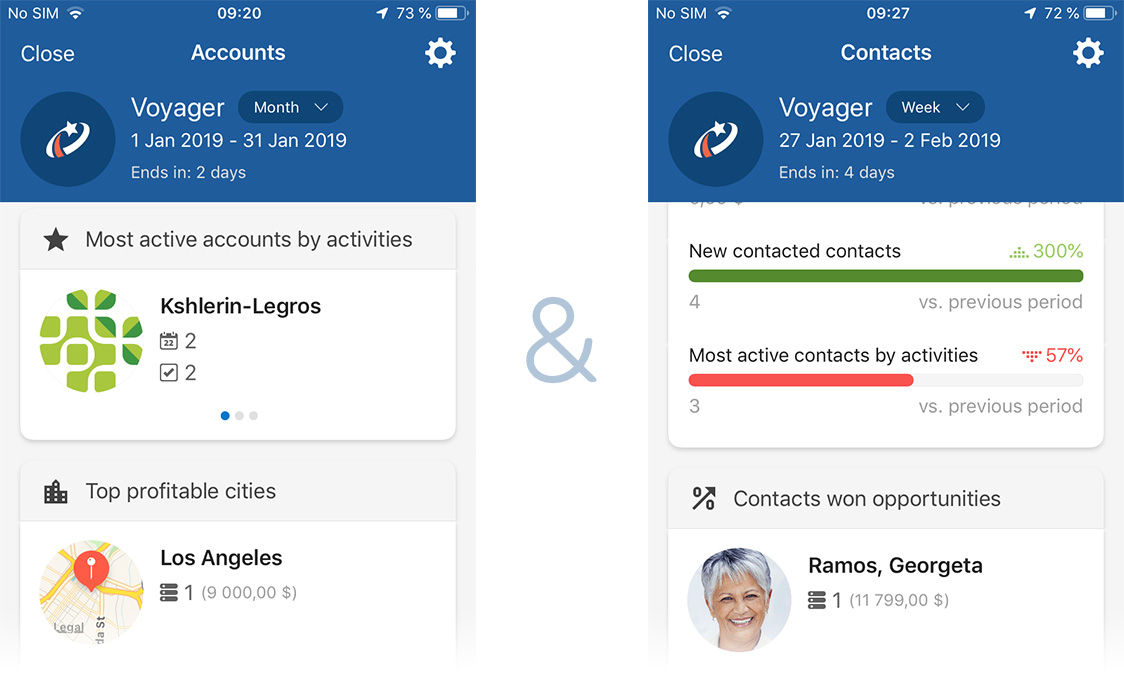
The view for Accounts and Contacts is Winning Percentage, which compares a salesperson’s and sales team’s revenue from opportunities to the previous period. The Quick Status shows you an instant, color-coded graphic.
You can drill down to the Winning Percentage analysis, which will provide more granular insights into a salespersons’s or sales team’s performance as regards to accounts and contacts.
Reach for the stars! Put Pipeliner Voyager AI for Mobile CRM to work for your sales team today.
