Predictive sales analyticsAnalytics Analytics is the active study of different types of data with the aim of discovering meaningful patterns and translating these into insight (such as historical analyses and forecasts), or action (such as those intended to improve business performance). and sales forecastingForecasting Forecasting is a prediction or calculation of a trend or event likely to occur in the future based on qualitative, quantitative and historical data as well as emergent but relevant factors. are often confused. They are related but not the same. Forecasting answers “How much revenueRevenue Revenue is the amount of money a business generates during a specific period such as a year or a quarter; also called sales. will we close?” Predictive analyticsPredictive Analytics Predictive Analytics refers to the field or tool that uses historical data, statistical models, emergent trends and other information to formulate an informed forecast about the future, usually with regards to the performance, growth, or feasibility of a business. answers “Which deals will close, which reps need coaching, which accounts are at churnChurn Churn is a term that describes the percentage of customers that leave or cancel a service or product within a given period of time. risk, and where should we focus next?”
Modern CRM platforms now embed multiple predictive models. Deal scorers predict which opportunities are most likely to close. Activity scorers predict the optimal next action for each deal. Churn models predict which customers are likely to leave. LeadLead Lead refers to a prospect or potential customer (who can be an individual or organization) that exhibits interest in your service or product; or any additional information about such entity. scorers predict buyerBuyer A buyer is an individual or organizational entity that purchases a product or subscribes to a service. intent.
This guide clarifies the definitions, explains what dataData Data is a set of quantitative and qualitative facts that can be used as reference or inputs for computations, analyses, descriptions, predictions, reasoning and planning. feeds predictive models, walks through the outputs you should expect, and shows you how to evaluate predictive analytics capabilities in a CRM.
Definitions: Predictive Analytics vs. Forecasting vs. PipelinePipeline Sales pipelineis a visual representation of the stage prospects are in the sales process. Analytics
Predictive Analytics
Predictive analytics use historical data and machine learningMachine Learning Machine Learning is an aspect or type of artificial intelligence whereby a computer possesses the ability to learn various things by itself without explicitly being programmed to. to forecast future outcomes at the deal, rep, accountAccount Account refers to a record of primary and background information about an individual or corporate customer, including contact data, preferred services, and transactions with your company., or customerCustomer Customer is an individual or an organization that purchases a product or signs up for a service offered by a business. level. Examples include deal win probability scoring, churn risk scoring, and next-best-action recommendations. Output is typically a score (0 to 100) plus a reason. The model updates continuously as new data flows in.
Sales Forecasting
Sales forecasting aggregates individual deal probabilities to predict total revenue expected to close within a specific time frame. It answers “How much revenue?” Forecasting is forward-looking and time-bound: “Q2 forecast is 2.5M.” Forecasting combines probability scoring with deal amounts and close dates.
Pipeline Analytics
Pipeline analytics are descriptive, not predictive. They measure current state: pipeline size, deal velocity (average days in stage), win rates by stage, average deal size, and conversionConversion Conversion is the process of turning a target consumer into a paying customer; or more generally, the point at which a user performs a specific action favorable to a marketer or a seller. rates from stage to stage. Pipeline analytics answer “What do we have?” Predictive analytics answer “What will happen?”
Reporting
Reporting is historical. Dashboards show closed revenue, attainment vs. quotaQuota Quota is a predefined benchmark indicating the amount of sales a selling unit such as a sales rep or a regional sales team should achieve within a given period, often used as a measure of success, performance and eligibility for commissions and other rewards., and rep performance in prior periods. Reporting is retrospective. Predictive analytics are prospective and prescriptive: they tell you which deals to focus on and which reps need support.
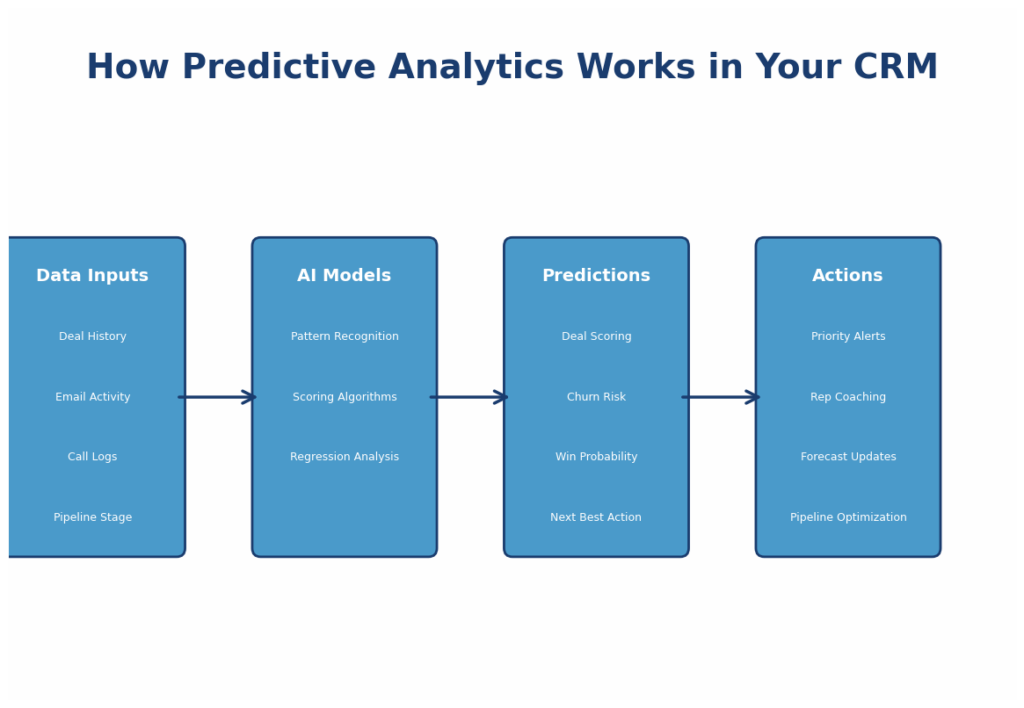
What Data Feeds Predictive Models: Data Inputs Checklist
Predictive models need raw material. The more complete and consistent your data, the better the model performs. Here is what the best CRMs ingest:
Deal-Level Data
- Deal amount and close date
- Stage and time in each stage
- Rep assignment and rep tenure
- Buyer engagementEngagement Engagement is the state or process of keeping a specific class of audience (employees, management, customers, etc.) interested about a company or brand and invested in its success because of its perceived relevance and benefits to the audience.: number of stakeholders, their titles, engagement frequency
- Activity: calls, emails, and meetings logged in the past 30, 60, and 90 days
- Contract status: draft, signature pending, executed
- Pricing and discountDiscount Discount means a promotional reduction in the cost of a product or service, commonly deployed to speed up sales. applied
Account-Level Data
- Industry and firmographicFirmographic Firmographic is a set of descriptive attributes of prospective organizational customers that can be used to classify firms into relevant or applicable market segments. data
- Annual revenue and employee count
- Existing customer status (new, expansion, renewal)
- Adoption depth (if expansion, how much of the productProduct Product refers to anything (an idea, item, service, process or information) that meets a need or a desire and is offered to a market, usually but not always at a price. is in use)
- Support ticket volume and sentiment (for churn models)
- Net Promoter Score or customer health score, if available
Rep-Level Data
- Tenure and experience level
- Historical win rate and average deal size
- Quota attainment (year to date and historical)
- Specialization or verticalVertical Vertical refers to a market where a business targets only a small subset of customers such as a specific industry, sector, profession, or niche. For example, manufacturers of jet plane engines cater only to companies that produce or maintain jet planes. focus
External and Intent Data (Optional)
- Buying signalBuying Signal Buying Signal is a verbal or non-verbal cue from a prospect is ready to make a purchase. For example, signing a contract. data from intent platforms
- Technographic data (which software does the account use)
- Published earnings or job postings that signal growth or transition
What Predictive Models Output
Deal Scoring and Win Probability
Each open deal gets a win probability score (0-100 or 1-5 stars). A deal with a 75 score means the model estimates a 75 percent probability of a close. The best models also provide the reason: “This deal scores high because the buyer has three active stakeholders and has requested a meeting in 5 days. It scores lower because it has been in NegotiationNegotiation Negotiation is a strategic dialogue, discussion, or bargaining process between two or more parties with the goal of reaching a mutually acceptable agreement. for 45 days.” Pipeliner CRM surfaces both the score and the reasoning, so managers can coach on specific gaps.
Churn Risk Scoring for Existing Customers
For expansion and renewal sales, predictive models score existing customers on churn risk. A score of 80 means 80 percent risk of churn. Models trigger on changes: support ticket spikes, usage drops, key contacts leaving, or renewals not rebooked. Sales teams use churn scores to identify at-risk customers early and intervene before customers leave.
Upsell and Cross-Sell Signals
Models identify accounts and customers most likely to buy adjacent products. An account using Product A but not Product B, with usage patterns that correlate with Product B needs, gets flagged as a high-upsell opportunity. Models surface the reason: “Account is using Modules A, C, and D, which historically appear together with Module B purchases.”
Next-Best-Action Recommendations
The most sophisticated predictive models tell reps what to do next. Instead of just scoring a deal, the model says, “Call the champion this week” or “Send a technical demo to the new stakeholderStakeholder Stakeholder is an entity with an interest in a company, process, or product, and which is typically concerned about its wellbeing. who joined last week.” Output is prescriptive, not just predictive.
Lead ScoringLead Scoring Lead Scoring is the process of assigning a relative value to each lead based on different criteria, with the aim of ranking leads in terms of engagement priority. for InboundInbound Inbound refers to interest (could be sales or marketing driven) that comes in – e.g. cold emails to you, submitted forms on your website, press inquiries, etc.
Inbound leads get scored based on firmographic, behavioral, and engagement data. A lead from a high-revenue account with strong website engagement receives a high score and is routed immediately to sales. A lead from a small account with low engagement gets a low score and is nurtured in marketingMarketing Marketing is the field, set of actions, or practice of making a product or service desirable to a target consumer segment, with the ultimate aim of effecting a purchase..
Predictive Analytics Evaluation for CRM Buyers
| Capability | Table Stakes | Differentiated |
| Deal Win Probability Scoring | Yes, by stage and deal age | Yes, with activity and buyer engagement signals |
| Reason/Transparency for Scores | No, just a number | Yes, the top 3 factors shown |
| Churn Risk Scoring | No | Yes, for existing customers |
| Lead Scoring | No | Yes, including engagement signals |
| Next-Best-Action Recommendations | No | Yes, prescriptive guidance |
| Activity-Based Signals | No, or very limited | Yes, automatic activity logging from email and calendar |
| Custom Model Training | No, one-size-fits-all | Yes, it can be tuned to your sales processSales Process Sales Process is a series of strategic steps or a set of activities aimed at driving sales growth through the alignment of personnel, market insight, methodologies, relevant business units, and technology. |
| Update Frequency | Monthly or quarterly | Weekly or daily |
| Mobile Visibility | No | Yes, scores in the mobile app |
Common Pitfalls and How to Avoid Them
Overfitting to Historical Data
Models trained too narrowly on recent history perform poorly on new deals. A model that learns “deals from Account Type X close 95 percent of the time” fails when Account Type X changes or when the rep changes. Mitigate by using multiple years of history and avoiding overly narrow segmentationSegmentation Segmentation is the process of subdividing a large market into distinct partitions (or segments) based on demographics and other factors, with the aim of formulating and implementing separate strategies to better engage the consumers in each segment.. Ask vendors about how they prevent overfitting.
Ignoring Context and External Events
A model trained on pre-recession data struggles during the recession. A model trained during an industry boom produces false positives during disruption. Good models flag when context has shifted. They also let humans add context. A manager should be able to say, “This deal is 30 points lower than usual because the buyer is evaluating our competitor heavily,” and have that manually adjust the score.
Trusting Scores Blindly
Predictive models are guides, not truth. A deal with a 30 score can still close if the rep fights for it. A deal with an 80 score can still be lost to a competitor. Emphasize to your team that scores inform strategy, not dictate it. Train managers to ask, “Why does the model score this deal at 35?” and then decide whether to intervene or reprioritize based on their judgment and the model’s input.
Data Quality Blindness
If 40 percent of deals have incomplete activity data (because reps do not log calls), the model trains on incomplete signals. Garbage in, garbage out. Implement automatic activity sync from email and calendar before activating predictive models. This ensures the model sees what actually happened, not what reps remembered to log.
Wrong Predictions for Your Process
A vendor trains their model on 500 SaaSSaaS SaaS is an acronym for Software as a Service. companies. Your business is professional services, with longer sales cycles and different buying dynamics. The out-of-the-box model performs poorly. Ask vendors: Can you customize or retrain the model on your data? Is there a way to weight factors specific to your sales process? Pipeliner CRM offers customizable Voyager AI models that let you emphasize factors most relevant to your sales cycleSales Cycle Sales Cycle is a repeating process characterized by a predictable sequence of stages that a company undergoes as it sells its products and services to customers..
Predictive Analytics Feature Mapping Across CRM Platforms
| Platform | Deal Scoring | Churn Risk | Next-Best-Action | Lead Scoring | Customizable |
| Salesforce | Einstein Scoring | Limited | Einstein Recommendations | Einstein Lead Scoring | Yes (custom fields) |
| HubSpot | Deal Scoring | No | Limited | Lead Scoring | Limited |
| Zoho CRM | Zia Scorecard | No | No | Lead Scoring | Limited |
| Pipeliner CRM | Voyager AI Scoring | Yes | Voyager Recommendations | Voyager Lead Scoring | Yes (advanced) |
| Pipedrive | Momentum Scoring | No | No | Limited | No |
| Freshsales | Deal Scoring | No | No | Lead Scoring | Limited |
Implementation Path: Getting Value from Predictive Analytics
Start narrow and expand:
- Month 1: Activate deal win probability scoring. Do not rely on it yet. Observe where it aligns with rep estimates and where it diverges.
- Month 2: Use scores for coaching. When a deal scores low, ask “Why? What is the actual blocker?” Learn whether the model is missing something about your process.
- Month 3: Activate lead scoring if inbound is a priority. Route high-score leads to sales immediately.
- Month 4: Add churn risk scoring if you have expansion revenue.
- Month 5 and beyond: Explore next-best-action recommendations and custom model training.
Conclusion
Predictive sales analytics are no longer experimental. CRM platforms now embed sophisticated models that score deals, identify churn risk, and recommend next steps. The best platforms, like Pipeliner CRM with Voyager AI, combine ease of use with transparency and customization. Success requires good data hygiene and a team mindset that treats model output as guidance, not gospel. Start with deal scoring, measure how often the model predictions match reality, refine as you learn, and expand to other use cases over time. Within six months, your team will make more data-driven, less opinion-driven decisions about where to focus sales efforts.
About Pipeliner CRM
Pipeliner CRM is an AI-powered sales CRM platform built for mid-marketMid-Market Mid-Market is a classification of business organizations in terms of scale (revenue, number of employees, etc.), occupying the segment between the small companies and large multinational enterprises serving the same market. B2BB2B B2B is an acronym for Business-to-Business, a model for selling, relationship-building, or engagement. sales teams. With its visual pipeline management, Voyager AI assistant, and no-code automation tools, Pipeliner helps sales organizations close more deals while spending less time on data entry and administration. Start a free 14-day trial at pipelinersales.com.