Sales Reporting
What is CRM
- What is CRM?
- Customer Relationship Management Software
- Account Management Software
- Contact Management Software
- Sales Lead Management
- Opportunity Management
- Sales Pipeline Management
- Customer Relationship Mapping
- Sales Enablement Tools
- Sales Management Software
- Sales Process
- Sales Reporting
- Task Management
- Custom Fields
- Team Collaboration
- KPIs for Sales & Leading and Lagging Indicators
- CRM Past Failures?
What is an Effective Sales Report and Forecast?
A sales report and forecastingForecasting Forecasting is a prediction or calculation of a trend or event likely to occur in the future based on qualitative, quantitative and historical data as well as emergent but relevant factors. are critical components of any business. It is a detailed document that displays an estimate for future company sales as well as all of the important dataData Data is a set of quantitative and qualitative facts that can be used as reference or inputs for computations, analyses, descriptions, predictions, reasoning and planning. you gathered through regular sales forecasting. Essentially, it predicts how many sales the sales rep, sales team, or overall business will make in the coming week, month, quarterQuarter Quarter is a three-month period in a company’s fiscal year commonly used to make comparative performance analyses, detect or forecast business trends, report earnings, and pay shareholder dividends., or year.
The primary goal of sales reporting and forecasting is to make high-level company members’ decision-making easier.
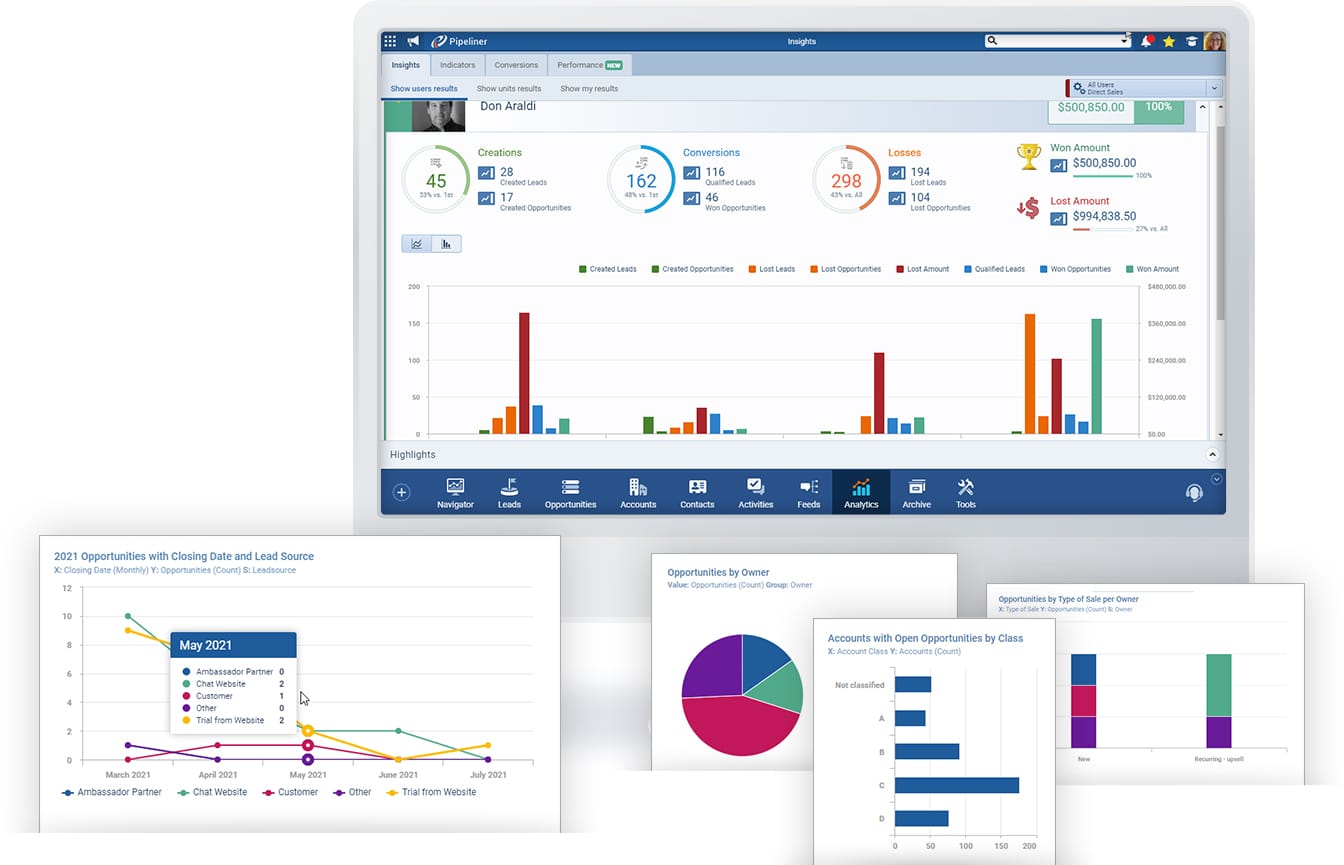
Essentially, it provides sales managers with an overview of all the company’s sales processes and operations. It serves as a reflection of the various trends in sales volume over a given time period and provides insight into the various sales funnelSales Funnel Sales Funnel is a visualization of the sales process that defines the stages through which prospective customers go through as they are led by sales professionals towards a purchasing decision. stages.
Why is it Important?
While sales reporting may not be as exciting as other, more creative aspects of the sales processSales Process Sales Process is a series of strategic steps or a set of activities aimed at driving sales growth through the alignment of personnel, market insight, methodologies, relevant business units, and technology., it is unquestionably an essential component of a successful sales strategy.
Once you understand the reasons for your data and results, you’ll have a better idea of where to direct your sales team’s efforts to drive decisions about production quantities, timelines, employment needs, pricing, and other essentials that keep your business running smoothly.
A sales report, according to its definition, is a powerful analyticsAnalytics Analytics is the active study of different types of data with the aim of discovering meaningful patterns and translating these into insight (such as historical analyses and forecasts), or action (such as those intended to improve business performance). tool that allows businesses to evaluate their current sales performance as well as their border sale strategy. However, it is more than just that.
In essence, you’ll have a bigger picture of how your company will perform in the coming period and will be able to make decisions based on that data.

Different Types
Different sales report formats focus on different sales KPIs, requirements, or strategies. Here are a few sorts of reports as examples:
Sales forecasts: These analyses project how much money your group will produce over a specific time frame. You might use them to prepare for anticipated company challenges or foresee seasonal slowdowns.
Reports on the Sales Funnel: These reports show how close a deal is to purchase your productProduct Product refers to anything (an idea, item, service, process or information) that meets a need or a desire and is offered to a market, usually but not always at a price. or service. The sales funnel teaches you how to nurture leads and convert them into customers.
ConversionConversion Conversion is the process of turning a target consumer into a paying customer; or more generally, the point at which a user performs a specific action favorable to a marketer or a seller. reports are similar to sales funnel reports in that they assess the progress of leads along the sales funnel. Still, they focus on the conversion of leads to customers rather than the status of leads along the funnel. A typical conversion tracking report includes information about contacts, leads generated and qualified, and wins, as well as period-to-period change rates.
Sales Call Reports: These cover calls made to leads, prospects, and customers to encourage them to purchase. Using these reports, you can learn about your reps’ performance and the qualities of your leads.
Experience Pipeliner CRM Now
What Should Be The Key Elements?
The key elements vary according to the type of report.
The following items must included:
KPIs that are relevant
Sales Volume
Gross Sales Percentage Change in KPI from the previous reporting period
Net Sales
How Do You Write a Sales Report?
Sales reports and forecasts are critical components of sales management. Without them, management cannot function properly, and sales targets cannot be accurately forecasted or set.
Here are some fundamental steps in developing reliable and effective sales reports and forecasts.
Data must be accurate
A sales report or forecast is only as accurate and reliable as the data used to generate it. That means anyone entering sales data, whether sales reps, inside reps, sales assistants, or other users, must enter accurate information. This includes revenueRevenue Revenue is the amount of money a business generates during a specific period such as a year or a quarter; also called sales. figures, time frames, quantities, and any other information relevant to your company’s report or forecast.
Many businesses place a high value on accurate data entry and penalize those who fail to do so. There’s a good reason for this: the company’s future is at stake.
Data must be accessible
Once accurate data has been entered, it must be easily accessible for the creation of a report or forecast.
Rapid Report and Forecasts Creation
Sales management is highly recommended always to be equipped with tools that allow for the quick creation of reports and forecasts. Anything less runs the risk of being inaccurate and taking too long.
Compile Your Data
Once you’ve determined your information requirements and data period, it’s time to start collecting data. This usually entails logging into your CRM software and retrieving data, then either downloading it for use in another programme or generating reports directly from your CRM dashboard.
Double Check Your Data
Before entering your meeting, it is critical to strike a balance between insight and abundance. You may not realize you’ve included too much or too little information until after you’ve completed your first draft of a report. It’s time to double-check your data after you’ve compiled it and created charts and graphs.
Explain Your Reports
The final and most important step is now. Again, simply presenting data is only half the battle; you must also put words to your data in order for it to be meaningful to your audience.
It is a capital mistake to theorize before one has data.
Final Thoughts
Sales reporting removes the guesswork from business decisions by providing a clear picture of where your company stands at each stage of the sales process. You can add more value to each individual salesperson and the company as a whole by focusing on measurable activities with clear outcomes.


