With Pipeliner CRM, it is easy for everyone to configure relevant and insightful Reports.

No admins, no coding skills and no support needed.
1-Click New Report is available in whatever view you happen to be on. Pipeliner also provide 24 pre-formatted Reports, Pivot Tables and much more.
Pipeliner CRM Reporting Features
Traditional CRM reporting can be complex and difficult to use. Much of the time a report must be created by a system administrator or a power userUser User means a person who uses or consumes a product or a service, usually a digital device or an online service., just so a sales managerSales Manager Sales Manager is an executive who leads a sales unit, team or department by setting goals and meeting targets, formulating plans and policies, designating tasks, and developing salespeople. or sales rep can use it.
Yet so many vital factors are dependent on reports, including future revenueRevenue Revenue is the amount of money a business generates during a specific period such as a year or a quarter; also called sales. and forecastingForecasting Forecasting is a prediction or calculation of a trend or event likely to occur in the future based on qualitative, quantitative and historical data as well as emergent but relevant factors., that such a function should never be difficult to access or utilize–it should be instantly and easily available to anyone.
With Pipeliner, we have gone the extra mile to ensure that reporting is as simple and intuitive as the rest of Pipeliner’s features–no special skills, admin or other tech assistance needed.
1-click reporting. From whatever view you happen to be on, or Profile or Filter you have set up, you can immediately generate an on-demand report, save it, and recreate it at any time. This feature makes it possible to create a report from virtually any view within Pipeliner CRM. Reports can also be instantly shared.
24 pre-formatted reports that can be utilized to provide powerful insights into sales opportunities.
Management reports provide in-depth comparisons, evaluations and statistics—all user-managed. Reports can be organized or sorted by any field in the report. They can also be personalized by user, and saved in created folders.
Dashboard reports provide real-time graphic views of sales team performance, offering 25 different ready-to-use reports. Such reports allow you, for example, to zero in on troubled or stalled areas, reps or opportunities; instantly discover in which sales stages deals are stalled, or where your revenue is being halted or generated.
Pivot Tables: Drill down into the dataData Data is a set of quantitative and qualitative facts that can be used as reference or inputs for computations, analyses, descriptions, predictions, reasoning and planning. and generate custom sales Reports from multiple data sources using the Pivot Table capability. Pivot Tables are easy to use, with a graphical interface enabling the user create relevant reports in real time without leaving the screen.
Sales Activities
Pipeliner CRM Benefits
Pipeliner CRM brings a whole new level of consistency and predictability to your business. It is visual, always available and won´t break your budget.
Visual, intuitive and at affordable price
- Always available and focused on productivity and efficiency
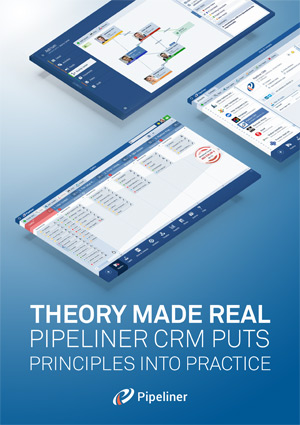
Theory Made Real: Pipeliner CRM Puts Principles into Practice
 Based on proven economic principles, Pipeliner CRM is a tool for everyone.
