KPIs for Sales & Leading and Lagging Indicators
What is CRM
- What is CRM?
- Customer Relationship Management Software
- Account Management Software
- Contact Management Software
- Sales Lead Management
- Opportunity Management
- Sales Pipeline Management
- Customer Relationship Mapping
- Sales Enablement Tools
- Sales Management Software
- Sales Process
- Sales Reporting
- Task Management
- Custom Fields
- Team Collaboration
- KPIs for Sales & Leading and Lagging Indicators
- CRM Past Failures?
Pipeliner CRM makes full use of leading and lagging Key Performance Indicators (KPIs) for optimal opportunity and sales management.
KPIs for Sales: Leading and Lagging Indicators in Pipeliner CRM
Much of the time, sales management is conducted through KPIs called lagging indicators. These are KPIs that show what has already happened after all is said and done.
Understanding Lagging Indicators
Lagging indicators provide a retrospective view of sales performance, offering valuable insights into the effectiveness of past strategies. They are essential for gauging the business impact and identifying areas that have successfully driven results.
Common Lagging Indicators
Many companies rely on these metricsMetrics Metrics are quantities that are measured and used to: to evaluate success:
- RevenueRevenue Revenue is the amount of money a business generates during a specific period such as a year or a quarter; also called sales. BookingsBookings Bookings are the net new contracts signed, in dollar amounts (typically ACV or TCV).
- QuotaQuota Quota is a predefined benchmark indicating the amount of sales a selling unit such as a sales rep or a regional sales team should achieve within a given period, often used as a measure of success, performance and eligibility for commissions and other rewards. Attainment
- Win-Rates
- Renewals
- CustomerCustomer Customer is an individual or an organization that purchases a product or signs up for a service offered by a business. ChurnChurn Churn is a term that describes the percentage of customers that leave or cancel a service or product within a given period of time. Rates
These indicators help in assessing overall outcomes but come with limitations that must be acknowledged.
Limitations of Lagging Indicators
- Delayed Measurement: Since these indicators are collected after processes are completed, they often require longer interpretation, making it challenging to enhance sales representative productivity in real-time.
- Multiple Influencing Factors: While they reflect the results, lagging indicators don’t reveal the causal factors. This obscures the specific actions or decisions that influenced outcomes.
- Difficulty in Implementing Change: As the outcome is a collective result of the sales team, pinpointing exact areas for improvement becomes difficult, potentially misguiding sales trainingSales Training Sales Training is the process of improving the skills, behavior and mindset of sales professionals to upgrade their selling performance. efforts.
- Lack of Adaptability: In a dynamic sales environment, the inability to quickly adjust based on lagging dataData Data is a set of quantitative and qualitative facts that can be used as reference or inputs for computations, analyses, descriptions, predictions, reasoning and planning. can hinder proactive management and strategy shifts.
By understanding both the value and limitations of lagging indicators, sales teams can better strategize and complement these metrics with forward-looking data to drive continuous improvement.

Examples:
Sales
# of units sold
Gross marginGross Margin Gross Margin refers to total sales minus the cost of goods sold (COGS). Median for true SaaS cos is 71%, but what are considered to be “good margins” varies in SaaS. If you are running a marketplace/transaction revenue business, be very clear about gross margin.
# of different products sold
Market share
Gross revenue
# of deals won
# of deals lost
The problem with managing only through lagging indicators is right there in the name: lagging. By the time lagging indicators become clear, it is too late to change anything.
KPIs for Sales: Leading Indicators
The other kind of KPIs for sales management are leading indicators. Leading indicators are factors that can be monitored on a day-to-day basis, that give us an indication of how our lagging indicators are going to turn out. Examples:
- leads created
- new leads into the pipelinePipeline Sales pipelineis a visual representation of the stage prospects are in the sales process.
- leads converted to opportunities
- leadLead Lead refers to a prospect or potential customer (who can be an individual or organization) that exhibits interest in your service or product; or any additional information about such entity.-to-opportunity conversionConversion Conversion is the process of turning a target consumer into a paying customer; or more generally, the point at which a user performs a specific action favorable to a marketer or a seller. rate
- sales rep closing ratio
- team closing ratio
- % of opportunities through each sales stage
- opportunities proceeding within an expected time frame
Understanding Sales ProductivitySales Productivity Sales Productivity is a metric that indicates how efficient a sales unit is at closing sales and generating revenue for the company, based on sales volume, payroll expenses, level of personnel activity and other factors. KPIs
To evaluate sales productivity, it’s crucial to analyze a blend of activity, conversion, and outcome metrics. Let’s delve into the primary components:
Activity Metrics
These are the foundational actions that drive the sales processSales Process Sales Process is a series of strategic steps or a set of activities aimed at driving sales growth through the alignment of personnel, market insight, methodologies, relevant business units, and technology.. Key indicators include:
- Number of emails sent
- Number of calls made
- Number of meetings conducted<
- Number of opportunities created
By monitoring these actions, sales leaders can assess the level of activity among their teams in generating prospects and engaging with clients.
Conversion Metrics
Conversion metrics measure the effectiveness of sales activities in translating into actual sales progress. These include:
- Deal progression: Tracking how deals advance through various stages.
- Stage progression: Analyzing movement between different sales stages.
- Win rates: Understanding the percentage of deals closed successfully.
- Renewal rates: Evaluating the frequency of existing clients renewing their contracts.
These metrics reveal the efficiency with which potential sales are converted into completed deals.
Outcome Metrics
Outcome metrics provide insight into the results of the sales process. They cover:
- Total bookings: The sum of all confirmed sales.
- Average lead response time: The time it takes the team to respond to inquiries.
- Average sales cycleSales Cycle Sales Cycle is a repeating process characterized by a predictable sequence of stages that a company undergoes as it sells its products and services to customers. time: The typical duration to close a sale.
- Average deal size: The mean value of closed deals.
- Customer acquisition cost: The expenses incurred in attracting a new customer.
- Customer lifetime value: The total revenue expected from a customer over the relationship duration.
Evaluating these aspects helps align sales efforts with the company’s strategic goals and ensures long-term profitabilityProfitability Profitability is the potential, degree, metric, ability or relative efficiency of a business to yield financial gain (i.e., profits) after all relevant expenses and costs have been deducted..
By comprehensively understanding these components, sales teams can enhance productivity and better align their strategies with the organizationOrganization Organization is a cohesive group of people working together and formally bound by a shared identity (e.g., one team, company, club, etc.) and a common purpose (e.g., business growth, athletic victory, etc.).’s objectives.
Understanding Conversion Metrics and Their Impact on Sales Performance
Conversion metrics are key indicators used to evaluate the effectiveness of your sales strategies. These metrics provide insight into how well your sales team progresses leads through the sales funnelSales Funnel Sales Funnel is a visualization of the sales process that defines the stages through which prospective customers go through as they are led by sales professionals towards a purchasing decision. and closes deals. Let’s break down some of the most crucial conversion metrics and explore how they directly affect sales performance.
1. Lead Progression
This metric tracks leads as they move from initial contact to becoming a potential customer. By examining lead progression, sales teams can identify bottlenecks in the sales process and measure the efficiency with which leads are being nurtured. A smoother lead progression often translates to a higher conversion rate, boosting overall sales performance.
2. Sales Stage Transitions
Every sales process has distinct stages—from awareness to decision-making. Monitoring how quickly and efficiently prospects move through these stages provides a clearer picture of the sales pipelineSales Pipeline Sales Pipeline is a type of visualization showing the status of each sales prospect in the customer life cycle or sales process.’s health. Efficient stage transitions typically indicate effective sales techniques and increase the likelihood of securing more deals.
3. Closing Rates
Often referred to as win rates, this metric measures the percentage of sales that are successfully closed out of the total number of opportunities. High win rates indicate that sales strategies are effective and representatives are effectively addressing customer needs, thereby directly enhancing sales performance.
4. Renewal and Retention Rates
For businesses with subscription models or repeat customers, renewal rates are crucial. This metric provides insights into customer satisfaction and loyalty. High renewal rates imply strong customer relationships and stable revenue streams, reflecting positively on sales teams and their ability to maintain long-term customer engagements.
By understanding and analyzing these conversion metrics, sales managers can refine their strategies, improve team performance, and boost overall revenue growth.
Understanding Activity Metrics in Sales and Their Importance
What Are Activity Metrics?
Activity metrics in sales are quantifiable measures that provide insights into the daily actions taken by sales teams. These metrics typically include:
- Number of Emails Sent: Tracking outreach efforts through email.
- Number of Calls Made: Understanding phone engagementEngagement Engagement is the state or process of keeping a specific class of audience (employees, management, customers, etc.) interested about a company or brand and invested in its success because of its perceived relevance and benefits to the audience. levels with potential clients.
- Number of Meetings Held: Gauging one-on-one interactions with prospects and clients, whether virtual or in-person.
- Number of Opportunities Created: Counting the leads and prospects that turn into potential sales opportunities.
Why Are Activity Metrics Important?
These metrics serve as vital indicators of a sales team’s efficiency and engagement levels. By closely monitoring these activities, sales leaders can:
- Assess Productivity: Evaluate how effectively the sales team is reaching out to potential clients and nurturing leads.
- Identify Improvement Areas: Highlight where adjustments are needed in the sales process or training to enhance results.
- Align with Business Goals: Ensure that daily sales activities are contributing to broader organizational objectives.
By analyzing activity metrics, companies can tailor their strategies to drive success, optimize processes, and ultimately increase revenue.
Understanding Outcome Metrics and Their Role in Achieving Company Objectives
Outcome metrics are crucial indicators used to evaluate the effectiveness of a sales strategy. They offer a glimpse into how well a company is performing in pursuit of its broader goals. Here’s a breakdown of what these metrics entail and why they matter:
- Bookings: This metric tracks the total value of sales contracts signed within a specific period. It helps assess the effectiveness of sales efforts and forecasts revenue growth.
- Average Lead Response Time: The average time the sales team takes to reach out to potential customers. This metric is vital because quicker responses can lead to higher conversion rates, ensuring potential leads don’t lose interest.
- Average Sales Cycle Time: This refers to the time it takes to close a deal from the first customer contact to the final sale. Shorter sales cycles can indicate a more efficient sales process, helping to increase overall productivity.
- Average Deal Size: Represents the average revenue generated per transaction. This can guide strategies in targeting larger, more profitable deals and enhance customer segmentationSegmentation Segmentation is the process of subdividing a large market into distinct partitions (or segments) based on demographics and other factors, with the aim of formulating and implementing separate strategies to better engage the consumers in each segment..
- Customer Acquisition Cost (CAC): This metric calculates the cost involved to acquire a new customer. Monitoring CAC ensures that marketingMarketing Marketing is the field, set of actions, or practice of making a product or service desirable to a target consumer segment, with the ultimate aim of effecting a purchase. and sales efforts are cost-efficient and contribute positively to profit margins.
- Customer Lifetime Value (CLV): CLV estimates the total revenue a business can expect from a customer throughout their relationship. A higher CLV indicates stronger long-term value, underpinning investments in customer retention strategies.
By regularly analyzing these outcome metrics, sales leaders can gain actionable insights into sales productivity. These metrics serve not only as performance indicators but also as strategic tools that highlight areas needing improvement, align sales activities with business goals, and ensure that every action taken drives the company toward its overarching objectives.
KPIs for Sales: Combining Leading and Lagging Indicators
The combining of leading and lagging indicators give you a full picture of your operation and allow you to make changes to improve the scene before your lagging indicators come into effect.
You should be able to utilize your leading indicators to show how your lagging indicators are going to appear. For example, if you add up the value of your opportunities in the pipeline, the percentage chance of them making it through, the rankings of each deal, and other leading factors, you see that, if all goes according to plan, you’ll have $1.5 million for the quarterQuarter Quarter is a three-month period in a company’s fiscal year commonly used to make comparative performance analyses, detect or forecast business trends, report earnings, and pay shareholder dividends.. If you add up all your leading indicators and see that you’re falling short of your target, you then have time to do something about it. For example:
- Get more leads into the pipeline
- Take steps to raise lead-to-opportunity conversion rates
- Coach and mentor your reps to raise closing ratios
- Make sure you have no unnecessary activities or tasks
- Make sure all necessary activities and tasks are being done
- Monitor your sales process to makes sure it is efficient
Elevating Sales Performance Through Tailored Enablement Plans
Understanding the Role-Specific Benefits of Leading Indicators
In a sales organization, crafting enablement plans that include role-specific metrics can significantly enhance performance. By focusing on leading indicators, sales teams can proactively guide training, onboardingOnboarding Onboarding is the process or act of introducing a new customer to your product or service; or integrating a newly hired employee into your workforce or team., compensationCompensation Compensation is the total payment and benefits an employee receives for rendering work — covering basic salary, allowances, commissions, bonuses, health insurance, pension plans, paid leaves, stock options, and other benefits., and future forecasts. This approach not only boosts individual productivity but also serves as a powerful multiplier for overall business success.
Sales Development
For those in sales development, the emphasis is on integrating knowledge acquisition with tangible activities. Superior enablement plans should combine training achievements with real-time activity data from platforms like Salesforce, Salesloft, and Outreach. While some metrics like incentive compensations can lag, focusing on proactive actions yields immediate insights. Key indicators include:
- Completion of training modules
- Demonstrations of competency through certifications
- Total calls made and emails sent
- Number of videos shared
- Scheduled meetings
AccountAccount Account refers to a record of primary and background information about an individual or corporate customer, including contact data, preferred services, and transactions with your company. Executives
Account Executives, whether engaging with small businesses or large enterprises, benefit enormously from tracking both leading and lagging metrics. Kickoff times for meetings, demonstrations, and deals are crucial to understanding and improving efficiency. Important indicators to consider are:
- Completion status of training sessions
- Validation of pitching and communication skills
- Volume of calls and emails
- Meetings and demonstrations arranged
- Timeframes for securing initial and subsequent deals
Customer SuccessCustomer Success Customer Success is a proactive mindset, function, department or strategy commonly adopted by B2B companies to optimize business with customers, reduce churn rate, drive profits and increase the predictability of recurring revenue.
The customer success team requires a unique enablement strategy distinct from sales development and account executives. Their role is more consultative, focusing heavily on customer satisfaction and retention, making it essential to tailor indicators to these responsibilities. Here are some of the critical actions:
- Progress in training programs
- Achievement of key certifications
- Volume of customer-focused communication
- Scheduled customer meetings
- Initial engagement and regular business reviews
The Takeaway
Implementing structured enablement plans with precise leading indicators aligns each role’s objectives with the organization’s strategic goals. This alignment not only fosters individual growth but also translates to collective success, optimizing the sales team’s effectiveness across the board. By monitoring and refining these indicators, sales organizations can stay ahead of market demands, ensuring sustained growth and vitality.
When it comes to effectively mapping systems to processes in sales operationsSales Operations Sales Operations is a collection of aligned business processes, strategic implementations and other activities aimed at achieving organizational goals, specially in the areas of sales revenue, market coverage and growth., a strategic approach is essential. Here’s a step-by-step guide to get you started:
Start Small and Focused
Begin by selecting a specific role within your sales team. This targeted approach allows for more manageable and precise planning.
Outline Key Activities
Identify both the leading and lagging indicator activities for the chosen role. These are the tasks and outcomes that will guide your enablement efforts.
Engage Leadership
Consult with frontline managers and sales leaders to verify your activity list. Their insights ensure that your plan aligns with real-world needs and expectations.
Data and Systems Mapping
For each identified activity, map out the necessary data sources and systems that will be utilized. Understanding where to pull data from is critical for streamlined processes.
Business Intelligence Integration
Determine which business intelligence system will serve as your central data hub. This integration enables the efficient correlation of all necessary data.
Develop a Project Timeline
Create a detailed timeline and project plan. This includes ensuring all systems work in harmony, which is vital for seamless integration.
Report Modeling
Design your reports and dashboards around the mapped data and systems to ensure a seamless integration. These should offer clear insights into sales operations and performance.
Shareable Reports
Once finalized, distribute these reports and dashboards to all relevant stakeholders. This transparency fosters collaboration and alignment across teams.
By following these steps, you’ll foster cross-team collaboration and enhance overall sales productivity. Consistency and precision in executing these actions will ensure a smooth operational workflow.
Why Collaborating with Operations is Essential for Scaling Correlation AnalyticsAnalytics Analytics is the active study of different types of data with the aim of discovering meaningful patterns and translating these into insight (such as historical analyses and forecasts), or action (such as those intended to improve business performance). in Sales
Bringing together sales enablementSales Enablement Sales Enablement is a strategic process that provides a company’s sales professionals with tools, technology, training and other resources that improve their performance at customer engagement and at generating value for all stakeholders in the sales process. and operations is crucial for effectively scaling correlation analytics within a sales team. This collaboration provides a comprehensive view of processes, systems, data, and key sales metrics, ultimately leading to enhanced productivity.
Start Small for Big Wins
When integrating operations and sales analytics, it’s recommended to start with manageable steps. Initially, choose a specific sales role and tailor a detailed enablement plan around it. This targeted approach enables focused improvements and streamlines subsequent implementation.
Steps to Effective Integration
- 1. Identify the Role: Select a specific sales role to concentrate analytics efforts.
- 2. Define Indicators: List both leading (predictive) and lagging (outcome-based) indicators relevant to that role.
- 3. Validate with Leaders: Collaborate with front-line managers and sales leaders to ensure the indicators are accurate and useful.
- 4. Map Data Sources: Determine and catalog the necessary data sources and systems required for each activity.
- 5. Choose a BI System: Identify a business intelligence platform that can effectively unify and analyze the gathered data.
- 6. Plan Implementation: Develop a detailed timeline and project plan to integrate all necessary systems.
- 7. Design Reports: Create models for reports and dashboards that present the analytics in a concise and visually appealing manner.
- 8. Share Insights: Distribute the finalized reports and dashboards to all stakeholders, facilitating data-driven decision-making.
Achieving Significant Improvements
By systematically integrating operations, you pave the way for significant improvements in cross-team processes and overall sales productivity. This collaboration ensures that every action is backed by data-driven insights, making the sales process more efficient and scalable. This method not only optimizes the use of data but also enhances the team’s ability to make informed, strategic decisions.
Experience Pipeliner CRM Now
Use in CRM
The traditional CRM approach has been more or less to ”track everything”—primarily the reps, their calls, their progress, their activities and so on. Reps entered their contact, account and activity data.
But what should a CRM solutionSolution Solution is a combination of ideas, strategies, processes, technologies and services that effectively helps an organization achieve its goals or hurdle its challenges. show a company? The answer: Where sales have been, where they’re currently at, and where they’re going. In order for a CRM to do that, it must function with leading and lagging indicators, so it provides real insight.
No CRM has truly addressed this issue—until now.
Measure what is measurable and make measurable what is not so.
 Galileo Galilei
Pipeliner CRM: It’s Built Right In
Pipeline View
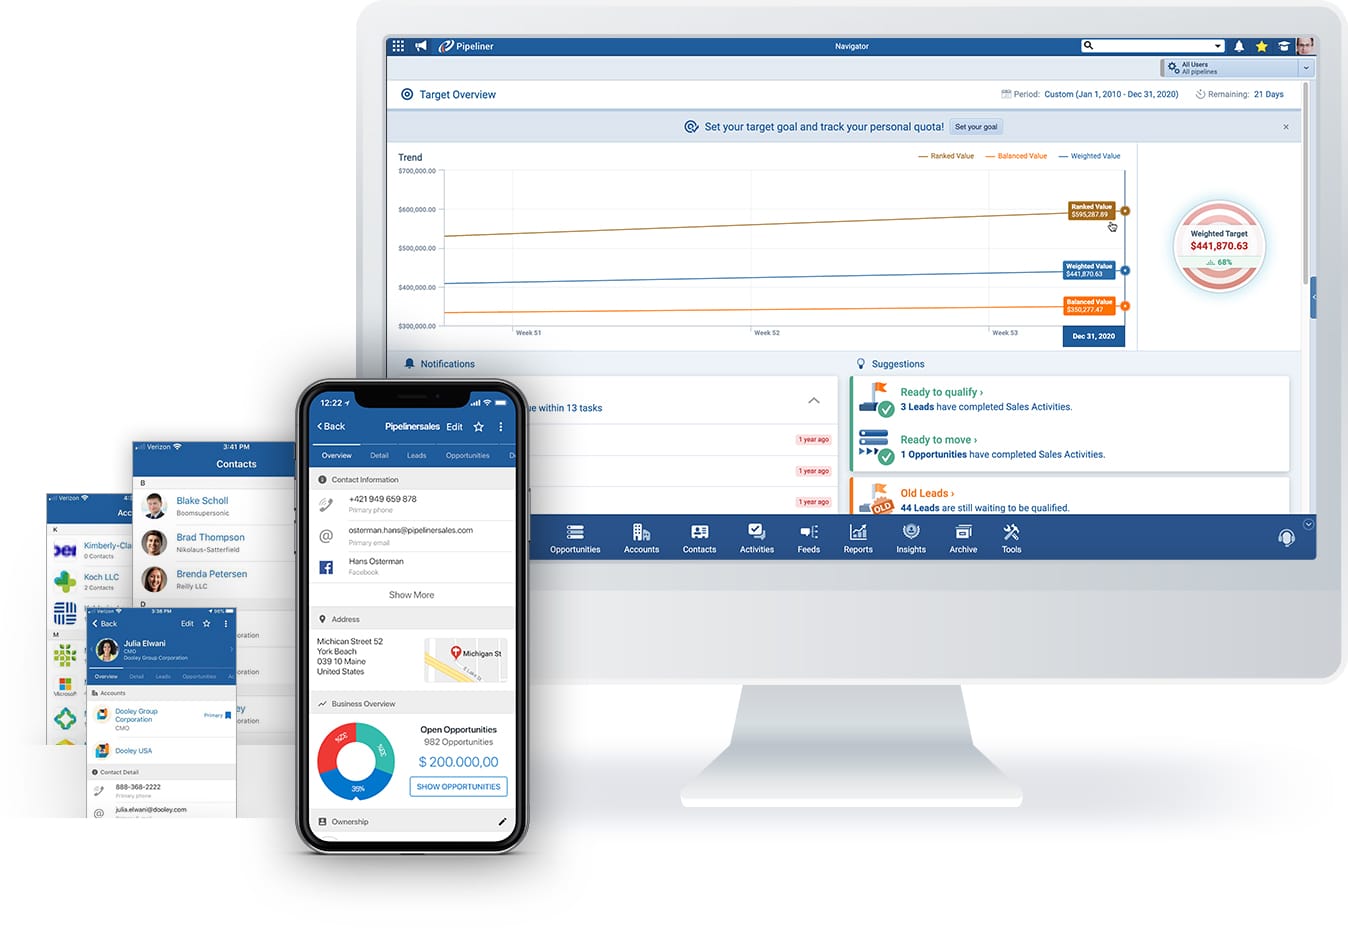
Unlike any other CRM solution, leading and lagging indicators are instantly and visually displayed. It’s all right there before you, starting with the main Pipeline View.
Right here you can see how many leads are available, how many opportunities are in each stage of the pipeline, and how many are overdue (per the average length of time for each stage). Your primary leading indicators are right there.
Target
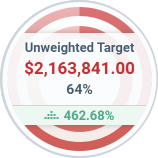
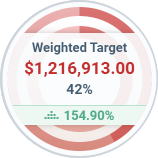
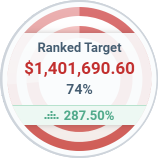
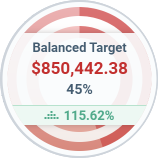
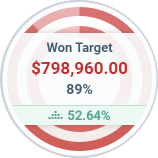
On the right-hand side, the target is always visible, showing your primary lagging indicators, and how they are affected by all the leading indicators as they now stand.
Archive
In Pipeliner, the most important lagging indicator is something not available in any other CRM: the Archive. The Pipeliner CRM Archive is arranged exactly the same as the active pipeline view. Leads and opportunities contain all information present when they were archived—including documents, emails, notes, social media interactions, tasks, and activities.
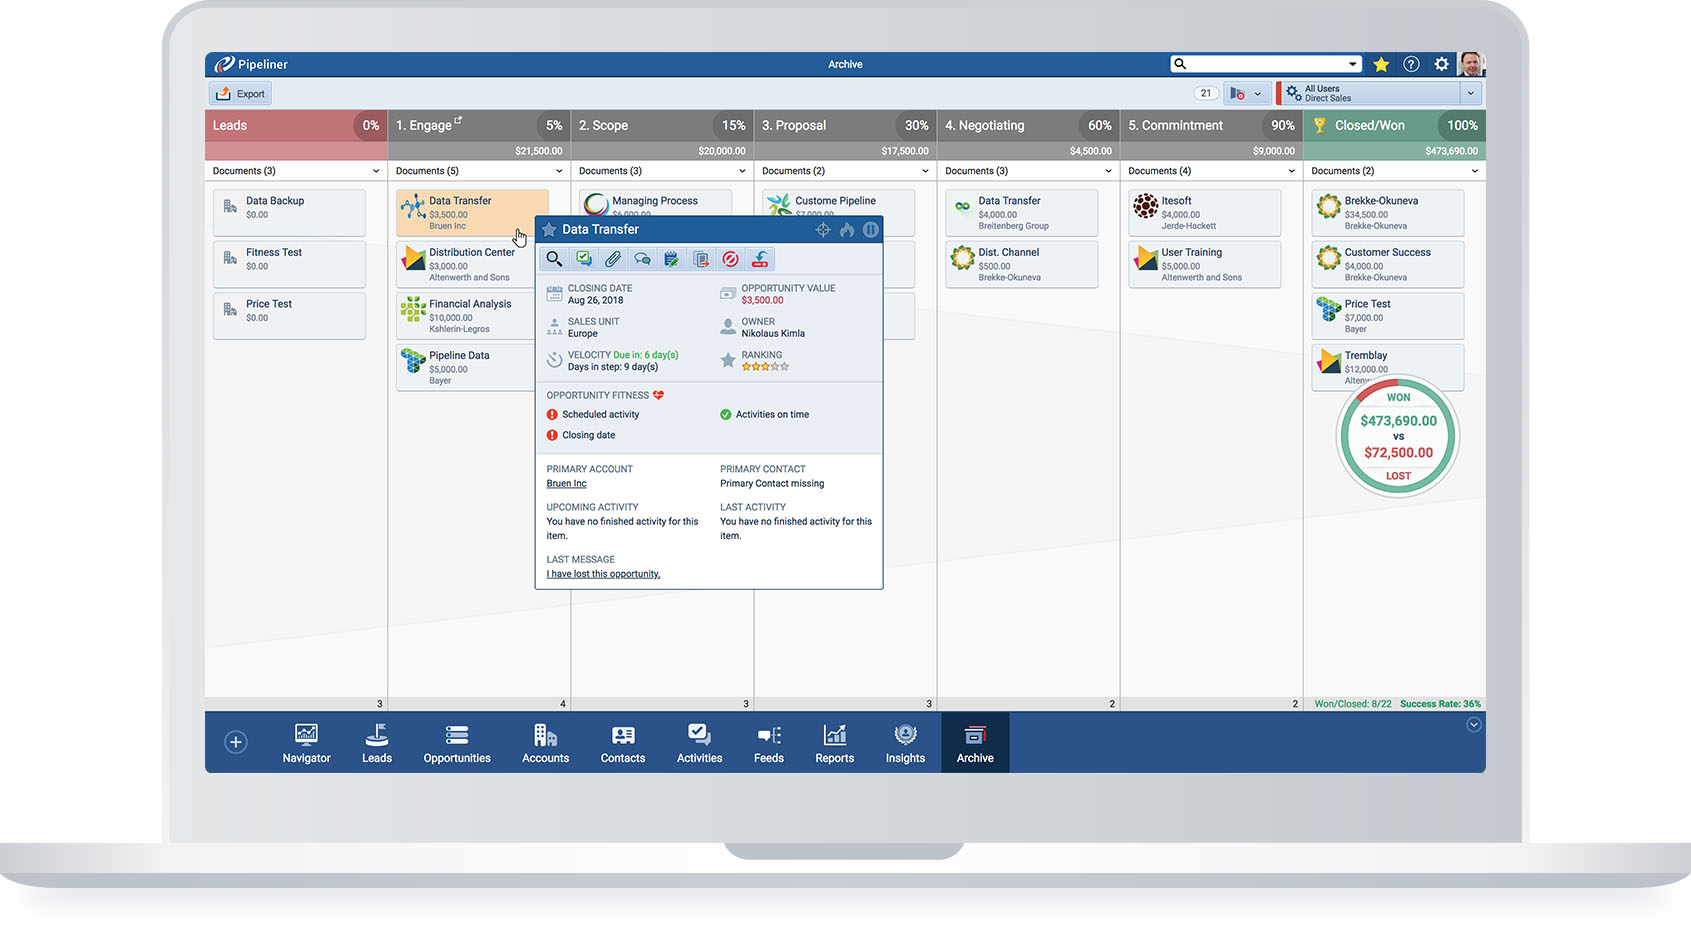
Instantly see stage in your Sales Process in which your opportunities got lost
Compare Won to Lost ratio of any numeric KPI in your Sales Pipeline
You can reactivate any Opportunity in your Archive and keep on moving it through your Sales Pipeline
 An in-depth analysis can be done right in the Archive of lost deals—with the same degree of detail that can be done with current opportunities. With Pipeliner’s new Multi-KPI feature, which is available both in the main Pipeline View and in the Archive, you can compare 2 different values (for example Revenue and Units Sold) or 2 different time periods. There has never been an analysis tool like the Pipeliner CRM Archive.
Pipeliner’s other features, such as filters, ranking, account view, and timeline all display leading and lagging indicators in various configurations, allowing you to instantly see how your leading indicators add up to your lagging indicators.
Sales Performance Insights
With Sales Performance Insights a sales leader or sales representative can see, at a glance, how various leading and lagging indicators have been combined so far for a sales unit, for reps as compared with other reps, and for territories as compared with others. Not only can you compare reps, but you can also compare various indicators for those reps.
Leading indicators include items such as created leads/opportunities, created accounts, and won opportunities. Lagging indicators include won opportunities, lost opportunities, won amount and lost amount.
For overall sales management and for calculating risk, Pipeliner takes both leading and lagging KPIs fully into account for optimal sales management.


