Stop swimming in spreadsheets and start seeing the future of your sales. Pipeliner CRM’s Pivot Table Reports are not just a feature—they are your secret weapon for transforming raw CRM dataData Data is a set of quantitative and qualitative facts that can be used as reference or inputs for computations, analyses, descriptions, predictions, reasoning and planning. into high-impact, actionable business intelligence.
Go beyond basic lists. With our intuitive Pivot Tables, you can cross-analyze multiple dimensions of your sales activity in minutes. Pinpoint success factors, diagnose bottlenecks, and make data-driven decisions that propel your team forward.

Why Pivot Tables are a Game-Changer for Sales Leaders
The Power of Cross-Dimensional Analysis
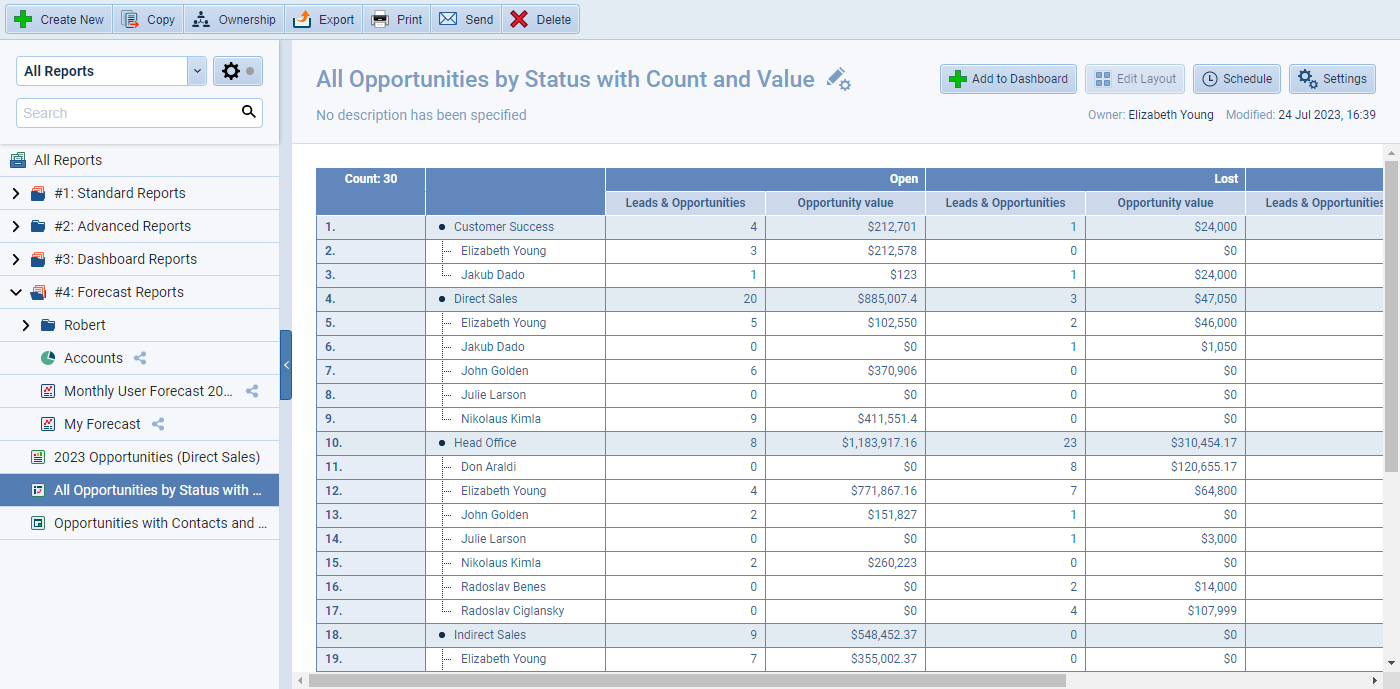
Traditional reports give you one line of sight. Pipeliner CRM Pivot Tables give you a 360-degree view. Easily select multiple rows, columns, and aggregate values to create complex, multi-layered views of your data.
Instantly see the ‘count of’ and ‘sum of values’ for Opportunities, broken down by Sales Step and Industry. No more manual lookups or complicated spreadsheet formulas—the answer is right there. You can simplify complex analysis by using drag-and-drop fields, instantly creating multi-dimensional reports without writing a single line of code.
Connect the Dots: Related Record Reporting
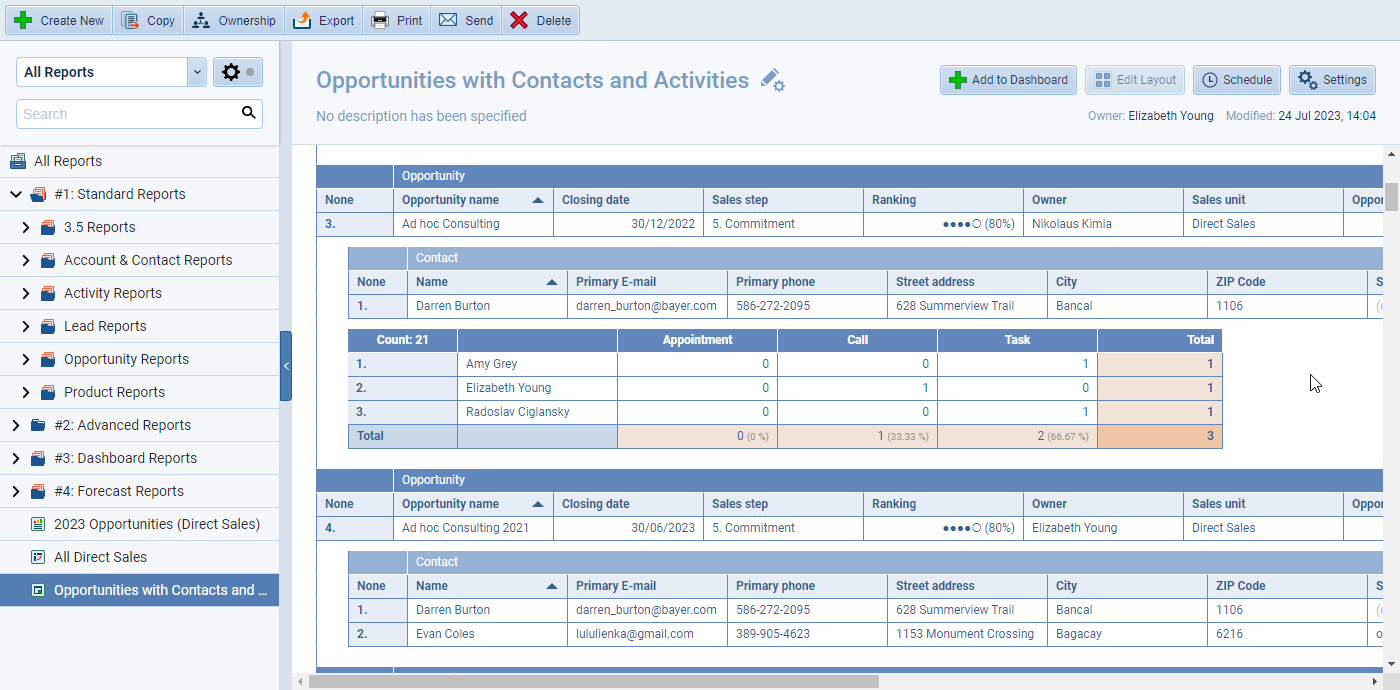
Your sales cycleSales Cycle Sales Cycle is a repeating process characterized by a predictable sequence of stages that a company undergoes as it sells its products and services to customers. involves more than one type of record. Pipeliner CRM’s Pivot Tables enable you to create reports based on a single primary record type (such as Opportunities) while seamlessly incorporating data from related documents (like Accounts or Products).
UserUser User means a person who uses or consumes a product or a service, usually a digital device or an online service. Advantage: A single Opportunity report can tell you the total value of products sold for a specific accountAccount Account refers to a record of primary and background information about an individual or corporate customer, including contact data, preferred services, and transactions with your company. manager within a given sales unit.
Dynamic Data, Real-Time Decisions
Your market changes every minute, and your data should too. Pipeliner CRM Reports are dynamic. As soon as a deal value changes, a status updates, or a new activity is logged, your Pivot Table report automatically updates to reflect the latest information.
Never make a decision based on stale data. You always view the most current, real-time view of your pipelinePipeline Sales pipelineis a visual representation of the stage prospects are in the sales process. performance, enabling lightning-fast insights and making timely, data-backed decisions.

Unlock Hidden Opportunities with Custom MetricsMetrics Metrics are quantities that are measured and used to:
Take control of how your data is summarized. With Value Configuration, you get maximum data flexibility. You can apply aggregation functions like Sum, Average, Min, Max, and Count, or compare values as a percentage (%) (e.g., Won Amount vs. Total Sales Amount). This level of detail allows you to segment performance and uncover precise trends.
An excellent report doesn’t just show you a number—it shows you the story behind the number. With Pipeliner CRM, you can click on any value in your Pivot Table to instantly drill down into the underlying list of records.
User Advantage: See a high-value cell in your report? Click it to view every individual Opportunity, Lead, or Account that contributed to that total, allowing for immediate investigation and action.
Seamless Collaboration & Sharing
When you have critical insights, you need to share them quickly. Easily share reports with colleagues as an Editor (to modify) or Watcher (read-only). For consistent, scheduled updates, you can set up a recurring email schedule (available in the EnterpriseEnterprise Enterprise (in the context of sales) is a relatively large organization typically composed of multiple levels, locations, and departments which need multi-layer software systems that support collaboration across a large corporate environment./Unlimited tiers).
Pipeliner CRM Pivot Table Reports FAQ
A Pipeliner CRM Pivot Table Report is an advanced reporting tool within Pipeliner CRM that enables users to cross-analyze data by selecting multiple rows, columns, and aggregated values (e.g., sum, count, average) based on a single record type, including information from related records. It is designed for complex data visualization and sales analyticsAnalytics Analytics is the active study of different types of data with the aim of discovering meaningful patterns and translating these into insight (such as historical analyses and forecasts), or action (such as those intended to improve business performance)..
Standard Reports are spreadsheet-style lists built on a single dimension (selectable columns). Pivot Tables enable multi-dimensional analysis by creating complex data breakdowns using multiple rows, columns, and values, making them ideal for comparative sales analysis and segmenting performance.
Yes. You can share your reports with other Pipeliner CRM users as Public (all users), Custom (specific users/Sales Units), and define their role as an Additional Editor (can modify) or Additional Watcher (read-only).
Yes. All Pipeliner CRM Reports are dynamic, meaning they automatically update in real-time as information within the Pipeliner CRM system changes.
Learn More About Pipeliner CRM
Take a no-obligation 14 day trial of Pipeliner CRM.
No credit card info required – just experience for yourself how it could impact your sales.


