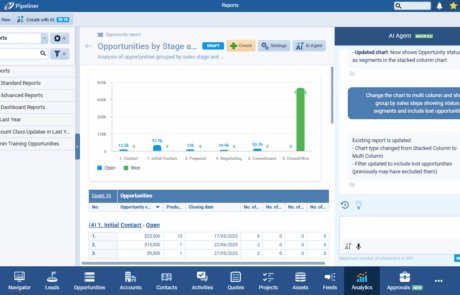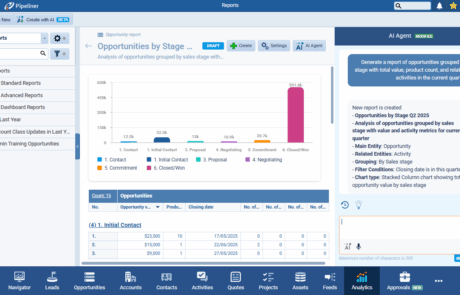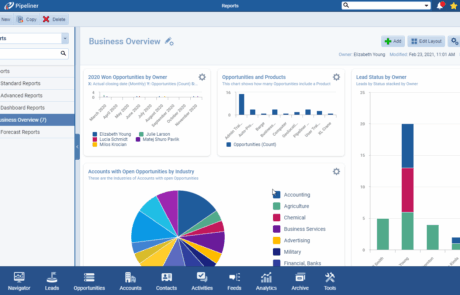
Stop guessing and start leading. Pipeliner CRM’s Custom Dashboards are the ultimate business intelligence (BI) tool, built right into your CRM. Move beyond static reports and generic views to create dynamic, personalized command centers that give you real-time, actionable insights into every facet of your sales processSales Process Sales Process is a series of strategic steps or a set of activities aimed at driving sales growth through the alignment of personnel, market insight, methodologies, relevant business units, and technology..
Forget spending hours exporting dataData Data is a set of quantitative and qualitative facts that can be used as reference or inputs for computations, analyses, descriptions, predictions, reasoning and planning. and building external reports. Your most critical metricsMetrics Metrics are quantities that are measured and used to: are now instantly accessible, fully customizable, and always up to date.
Why Pipeliner CRM Dashboards Are Your Competitive Edge
Pipeliner CRM’s Custom Dashboards are designed for speed and clarity. They give you the power to see, analyze, and act on your sales data like never before.
- Complete Customization, Total Relevance: Build dashboards with exactly the charts and reports your role demands, from high-level pipelinePipeline Sales pipelineis a visual representation of the stage prospects are in the sales process. summaries to granular territory performance. You create the view that matters most to you.
- Real-Time Agility: All charts and data are dynamic. When your team updates Pipeliner CRM, your dashboard instantly reflects the change. No more stale data!
- Instant Actionable Insights: Don’t just view data—act on it. Click any chart element to drill down to the underlying records, then take immediate action like updating an opportunity or following up on a leadLead Lead refers to a prospect or potential customer (who can be an individual or organization) that exhibits interest in your service or product; or any additional information about such entity..
- Powerful Trend Analysis: Use features such as Running Totals, Comparison Views, and To Current Date Comparison to spot trends, measure performance against previous periods, and accurately forecast results. You gain powerful foresight, not just a historical report.
- Effortless Sharing & Collaboration: Easily share customized views with stakeholders or apply dashboard-wide filters to instantly tailor the view for different users or teams without rebuilding every single chart.
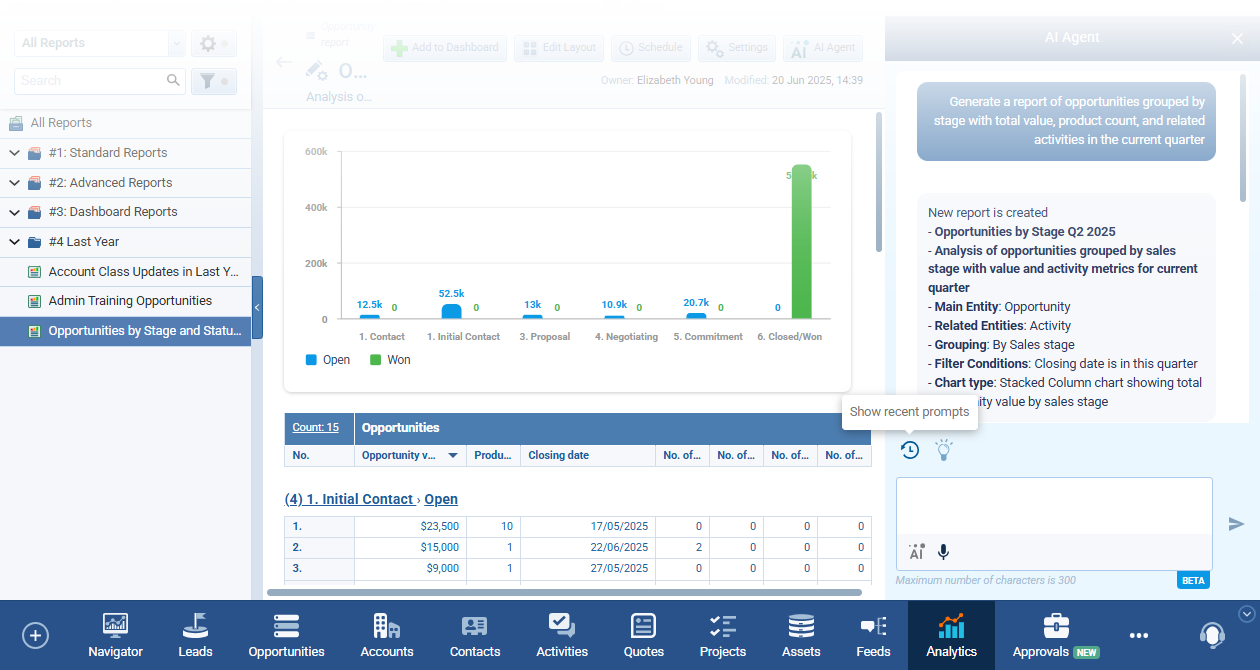
Features That Drive Faster Decisions
Pipeliner CRM’s Custom Dashboards provide the analytical tools you need to optimize your strategy.
Visualize Your Success with Diverse Chart Types
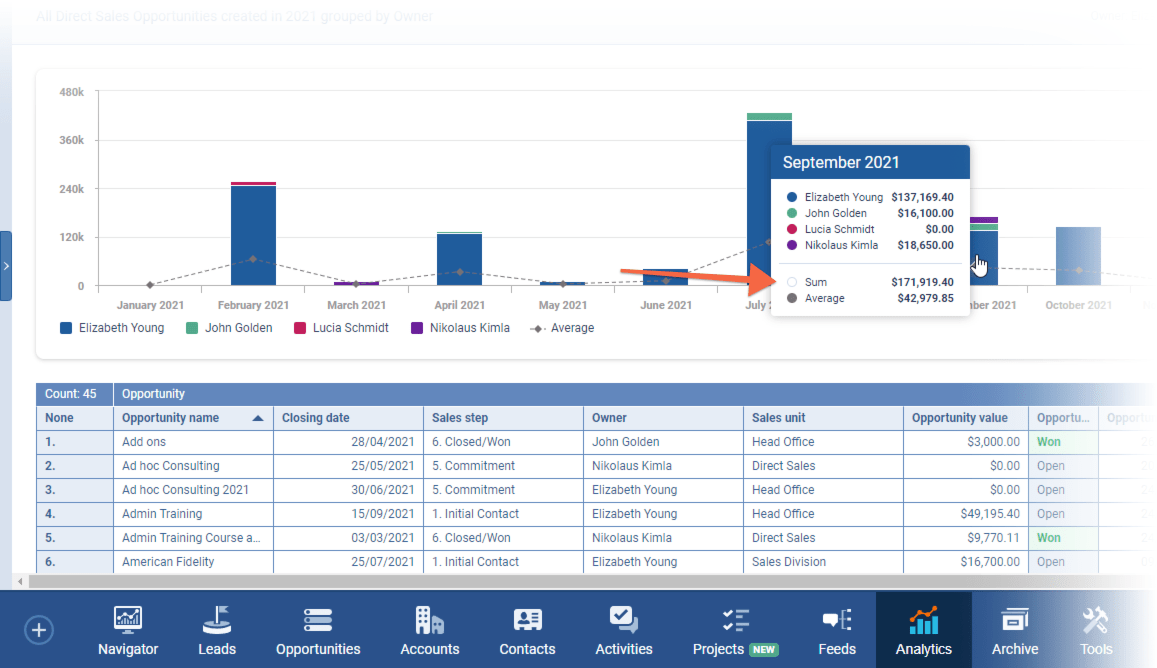
Select the ideal visual representation for each metric to ensure immediate clarity: Pie Charts for quick composition, Lines for powerful trend tracking, Columns and Bars for comparative analysis, and Scorecards for high-impact performance indicators.
Deep-Dive Analytical Tools
Access advanced features that turn simple reports into deep analytical dives:
- Comparison Views: Easily overlay current performance against previous periods or custom date ranges to visualize performance fluctuations and growth.
- Running Total: Track cumulative sums (like sales over time) to instantly identify sales peaks, valleys, and overall progress towards goals.
- Show Percentages & Numeric Values: Display critical metrics (like conversionConversion Conversion is the process of turning a target consumer into a paying customer; or more generally, the point at which a user performs a specific action favorable to a marketer or a seller. rates) directly on your charts for instant context.
- Custom Grouping: Easily switch how your multi-value fields are displayed to get the clearest picture of complex data relationships.
Seamless Workflow Integration
Your insights are only as valuable as your ability to share and leverage them:
- Easy Exporting: Export charts as PNG files or copy them directly to the clipboard for instant use in presentations or emails. Print entire dashboards to PDF for offline review or stakeholderStakeholder Stakeholder is an entity with an interest in a company, process, or product, and which is typically concerned about its wellbeing. reports.
- Scheduled Reporting: Schedule your Dashboard to be emailed as a PDF attachment to key users or managers regularly, ensuring everyone operates from the same source of truth.
- Fast Layout Editing: Drag, drop, and resize chart elements to create the optimal layout for your needs.
- This is the best CRM, and is extremely nimble and customizable.
↳ Rodney Mogen
(Director)
Custom Dashboards FAQ
A Custom Dashboard in Pipeliner CRM is your personalized, dynamic central command center for sales intelligence. While a standard report displays data for a single metric or dataset, a dashboard combines charts and visual elements from multiple reports onto a single screen. This provides a comprehensive, real-time snapshot of key performance indicators (KPIs) across your entire business—such as pipeline health, conversion rates, and team activity—all in one customizable view.
Pipeliner’s dashboards are built for speed and action. Unlike static spreadsheets, our visual charts allow you to drill down instantly. You can click any segment of a chart (like a specific sales rep’s column or a dropped opportunity stage) and immediately access the underlying list of records. From there, you can update, email, or take other immediate actions on those opportunities or accounts, making your data truly actionable.
Yes, absolutely. Pipeliner CRM’s security and sharing settings ensure that while you can share a Custom Dashboard across your team or organizationOrganization Organization is a cohesive group of people working together and formally bound by a shared identity (e.g., one team, company, club, etc.) and a common purpose (e.g., business growth, athletic victory, etc.)., each userUser User means a person who uses or consumes a product or a service, usually a digital device or an online service. will only see the data they have permission to view (e.g., their own opportunities or the territories they manage). This means you can create one comprehensive dashboard, and Pipeliner automatically filters the contentContent Content refers to a material or document released in various forms (such as text, image, audio, and video) and created to inform, engage or influence specific audiences. to provide a role-specific, secure view for every user.
Pipeliner offers advanced visualization tools for goal tracking. You can integrate Target values into your charts to see your progress against a quotaQuota Quota is a predefined benchmark indicating the amount of sales a selling unit such as a sales rep or a regional sales team should achieve within a given period, often used as a measure of success, performance and eligibility for commissions and other rewards.. Even better, use features like Comparison Views to benchmark your current results against previous periods, or leverage the Running Total feature to track the cumulative progress of sales over time. This makes it easy to spot trends and measure performance accurately in real-time.
Yes. You can easily export any Custom Dashboard to a PDF file with a single click for immediate sharing. For regular updates, you can schedule the dashboard to be automatically emailed as a PDF attachment to specific colleagues or external managers on a regular basis (daily, weekly, etc.), ensuring everyone works with the latest information.
Learn More About Pipeliner CRM
Take a no-obligation 14 day trial of Pipeliner CRM.
No credit card info required – just experience for yourself how it could impact your sales.

