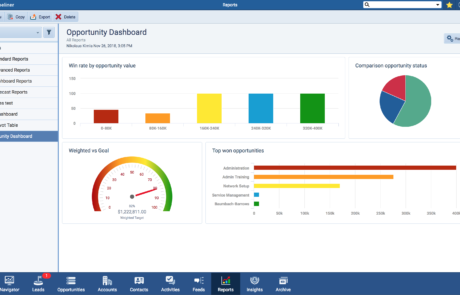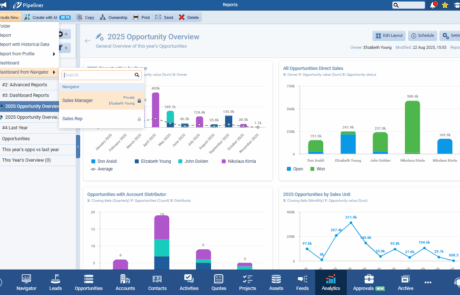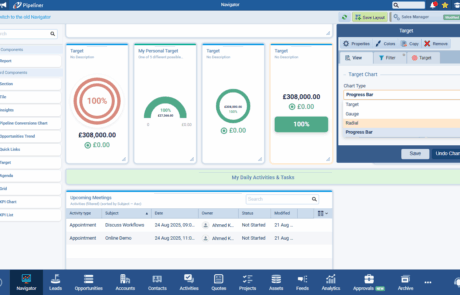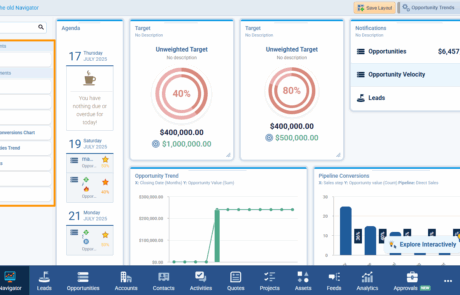
Gain crystal-clear insights and drive informed decisions with Pipeliner CRM’s powerful Dashboard feature. Designed to be your personalized command center, Dashboards provide a dynamic, at-a-glance overview of your critical business metricsMetrics Metrics are quantities that are measured and used to:, empowering you to track performance, identify trends, and take immediate action.
Why the Pipeliner CRM Dashboard is Essential for Your Business
Unrivaled Customization & Control
Tailored to Your Needs: No two businesses are alike, and neither should your dashboards be. Pipeliner CRM empowers you to create fully customizable dashboards with a variety of chart types drawn from your standard, pivot table, and advanced reports. Consolidate key metrics into a single, intuitive view that matters most to you.
Dynamic & Always Current: Say goodbye to outdated information. Our dashboards are dynamic, automatically updating with the latest dataData Data is a set of quantitative and qualitative facts that can be used as reference or inputs for computations, analyses, descriptions, predictions, reasoning and planning. as changes occur within Pipeliner. You’ll always have real-time insights at your fingertips, enabling agile decision-making.
Actionable Insights, Instantly: Dashboards aren’t just for viewing data; they’re for acting on it. Click on any element of a dashboard to drill down into the underlying data. From this detailed view, you can easily select records and navigate directly to update individual entries, ensuring your data always reflects reality.
Seamless Creation & Flexible Customization
Effortless Setup: Creating a new dashboard is intuitive. Start from the “AnalyticsAnalytics Analytics is the active study of different types of data with the aim of discovering meaningful patterns and translating these into insight (such as historical analyses and forecasts), or action (such as those intended to improve business performance).” menu, choose “Reports,” then “Create New” and select “Dashboard.” Name it, add a description, and choose a folder for easy organizationOrganization Organization is a cohesive group of people working together and formally bound by a shared identity (e.g., one team, company, club, etc.) and a common purpose (e.g., business growth, athletic victory, etc.)..
Populate with Purpose: Add contentContent Content refers to a material or document released in various forms (such as text, image, audio, and video) and created to inform, engage or influence specific audiences. with flexibility:
- New Reports: Create fresh reports with charts and integrate them directly.
- From Profiles: Generate new reports based on saved profiles to ensure consistency.
- Existing Reports: Utilize pre-existing reports, either by adding their charts or using their data to build new charts within your dashboard.
- Custom System Charts: Leverage built-in system charts, like conversionConversion Conversion is the process of turning a target consumer into a paying customer; or more generally, the point at which a user performs a specific action favorable to a marketer or a seller. rates between opportunity steps, for quick insights.
Diverse Visualization Options: Visualize your data exactly how you need it. Pipeliner CRM supports a wide array of chart types, including Pie Charts, Lines, Columns, Bars, and specialized Scorecards. For historical analysis, leverage Scorecard, Column, Bar, and Sankey charts for comparisons, or Line, Column, and Bar charts for trend reports.
Fine-Tune Your View: Customize chart elements to highlight what’s essential: display sums and averages, show percentages, enable comparisons against previous periods, or use a “Running Total” for cumulative analysis. Group data by combinations, individual values, or multi-select fields for granular insights.
Personalized Layouts: Drag, drop, and resize charts to create your ideal dashboard layout. Save your changes to maintain your preferred view.
Smart Filtering: Save significant time on shared dashboards by filtering the entire dashboard based on specific users or sales units.

Powering Your Contact Management Strategy
While not a standalone “Contact Management Dashboard,” Pipeliner CRM’s Dashboards inherently support and enhance your contact management:
- Track New Contacts: The Mobile App’s Activity Performance Card explicitly tracks and displays the creation of new Contacts, alongside other key activities, giving you a clear view of your growth in this area.
- AccountAccount Account refers to a record of primary and background information about an individual or corporate customer, including contact data, preferred services, and transactions with your company. Health Indicators: Leverage the “No. of related contacts” system field to define and visualize Account Health on your dashboards. Identify accounts that may be “unhealthy” due to a lack of associated contacts, prompting proactive engagementEngagement Engagement is the state or process of keeping a specific class of audience (employees, management, customers, etc.) interested about a company or brand and invested in its success because of its perceived relevance and benefits to the audience..
Secure & Controlled Access
Granular Permissions: Maintain data integrity and control access to sensitive information. Dashboard access, bundled with Reports, is managed through User Roles and Advanced Permissions in the Admin Module.
Flexible Access Rights: Administrators can set “Write access to records” for users to create new dashboards or “Read-only access to records” for viewing only.
Controlled Sharing: Decide who sees what with flexible “Sharing Rights.” Enable “Public sharing” for company-wide visibility or “Custom sharing” for specific users or sales units. Pipeliner CRM even warns you if underlying reports aren’t shared consistently, ensuring data visibility.
Extend Your Insights: External BI Integration
Seamless Data Export: For advanced analytics, Pipeliner CRM’s optional BI Feeder allows you to export your CRM data to a PostgreSQL database.
Connect to Your Favorite BI Tools: Integrate your Pipeliner CRM data with external Business Intelligence solutions like Google Data Studio, Microsoft Power BI, Tableau, or Qlik. Combine sales data with insights from MarketingMarketing Marketing is the field, set of actions, or practice of making a product or service desirable to a target consumer segment, with the ultimate aim of effecting a purchase., Finance, and other departments for a holistic view of your business.
Always Synchronized, Always Ready: The BI Feeder ensures daily data synchronization, providing current data for your external BI dashboards without impacting Pipeliner CRM App performance. Enjoy cost-effective, clientClient A client is an entity who pays another entity for products purchased or services rendered. Also called a customer.-side database maintenance while displaying real-time sales dashboards on large screens.
Functionalities Included
Dynamic Target Feature keeps a constant visual check on your target progress and is capable of showing more than one KPI.
Filter options allow you to filter and view tasks, contacts, accounts, leads and opportunities based on any field.

It provides your salespeople with a complete picture of their book of business.
Pipeliner CRM Dashboard: Frequently Asked Questions
The Pipeliner CRM Dashboard is your personalized command center for sales. It provides a dynamic, at-a-glance overview of your critical business metrics. You can use it to track sales performance, identify trends, monitor key data (like new contacts or account health), and make informed, immediate decisions based on real-time insights. It consolidates key metrics from your reports into a single, intuitive view.
You have unrivaled customization and control. Pipeliner CRM allows you to create fully customizable dashboards. You can:
- Add content from new or existing reports.
- Utilize a wide array of visualization options (Pie Charts, Lines, Columns, Bars, Scorecards, etc.).
- Drag, drop, and resize charts to create your ideal layout.
- Fine-tune your view by displaying sum/average values, percentages, or comparisons against previous periods.
- Apply Smart Filtering to save time on shared dashboards.
The Pipeliner CRM Dashboards are dynamic and always current. They automatically update with the latest data as changes occur within Pipeliner. This means you will always have real-time insights at your fingertips, enabling you to act on the most current information.
The Dashboard is designed for actionable insights. You can click on any element of a dashboard to “drill down” into the underlying data. From this detailed view, you can easily select records and navigate directly to update individual entries, ensuring your data reflects reality and enabling immediate corrective action.
Access is secure and controlled through UserUser User means a person who uses or consumes a product or a service, usually a digital device or an online service. Roles and Advanced Permissions in the Admin Module. Administrators can:
- Set “Write access” for users who need to create new dashboards.
- Set “Read-only access” for users who only need to view them.
- Use flexible “Sharing Rights” to enable “Public sharing” (company-wide) or “Custom sharing” for specific users or sales units. Pipeliner helps ensure consistency by warning you if underlying reports aren’t shared properly.
Learn More About Pipeliner CRM
Take a no-obligation 14 day trial of Pipeliner CRM.
No credit card info required – just experience for yourself how it could impact your sales.


