In sales, time is money, and insight is power. Are your sales strategies working? Where are your best leads coming from? What’s slowing down your pipelinePipeline Sales pipelineis a visual representation of the stage prospects are in the sales process.?
Pipeliner CRM Insights provides the definitive answers you need to eliminate guesswork and drive profitable change. This isn’t just reporting—it’s a high-definition, metric-driven view of your sales universe, presented in visual, actionable formats designed for the modern sales managerSales Manager Sales Manager is an executive who leads a sales unit, team or department by setting goals and meeting targets, formulating plans and policies, designating tasks, and developing salespeople..
The Pipeliner CRM Insights Advantage: Clarity, Coaching, and Confidence
You need dataData Data is a set of quantitative and qualitative facts that can be used as reference or inputs for computations, analyses, descriptions, predictions, reasoning and planning. you can trust to make tough calls. Pipeliner CRM Insights delivers it:
- Fair & Informed Coaching: Instantly compare individual userUser User means a person who uses or consumes a product or a service, usually a digital device or an online service. and sales unit KPIs against shared benchmarks. Quickly identify top performers and target specific coaching for reps who need it most, all thanks to the Indicators & Insights Tabs.
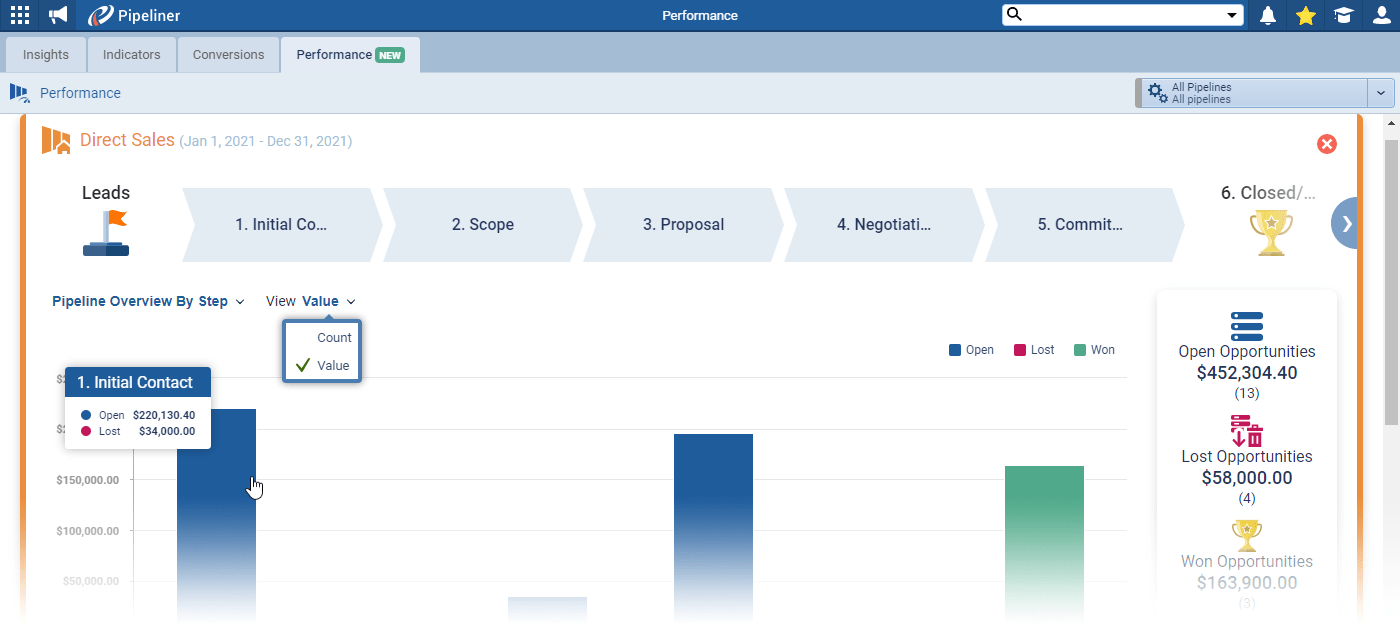
- Eliminate Bottlenecks: Easily visualize the average time spent on each pipeline step, broken down by user and step, in the Performance Tab. Pinpoint specific sales processSales Process Sales Process is a series of strategic steps or a set of activities aimed at driving sales growth through the alignment of personnel, market insight, methodologies, relevant business units, and technology. hurdles and dramatically reduce your sales cycleSales Cycle Sales Cycle is a repeating process characterized by a predictable sequence of stages that a company undergoes as it sells its products and services to customers. velocity.
- Optimize Resources: The Conversions Tab shows the end-to-end pathway of every Lead and Opportunity, from creation to closure. Understand exactly where your most valuable, high-converting deals originate and focus your marketingMarketing Marketing is the field, set of actions, or practice of making a product or service desirable to a target consumer segment, with the ultimate aim of effecting a purchase. spend for maximum ROI.
- Unquestionable Accuracy: Make critical decisions with confidence, knowing the underlying data is reliable and accurate. Insights are built on unchangeable system-based metricsMetrics Metrics are quantities that are measured and used to:, such as ‘Actual Close Date’ and the user who acted, rather than easily modified fields, ensuring your reports are immune to human error.
Key Features That Drive High Performance
Pipeliner CRM Insights breaks down complex data into four powerful, easy-to-use views, giving you a 360-degree look at your sales machine:
The Insights Tab: Your Visual Command Center
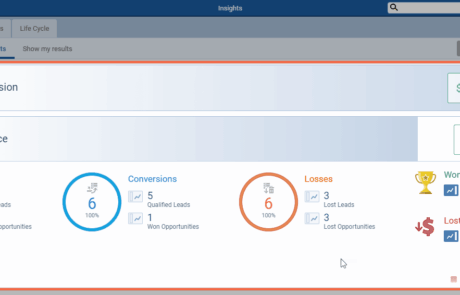
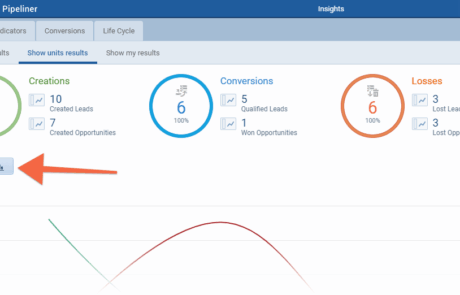
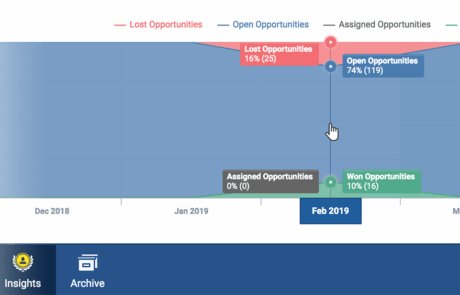
Get a quick, comparative view of core sales metrics through dynamic trend graphs and bar charts.
- KPI Comparison: Visualize the difference between Leads/Opportunities created, Won/Lost totals, and conversionConversion Conversion is the process of turning a target consumer into a paying customer; or more generally, the point at which a user performs a specific action favorable to a marketer or a seller. rates.
- Segment by Success: Easily view data by User or Sales Unit over different timeframes.
- Campaign-Specific Focus: Use the Power Panel to filter data by marketing campaign, industry, leadLead Lead refers to a prospect or potential customer (who can be an individual or organization) that exhibits interest in your service or product; or any additional information about such entity. source, and more, giving you laser-like focus.
The Indicators Tab (For Managers): Benchmarking at a Glance
Managers gain a potent edge with enhanced, single-click KPI comparisons across their entire team.
- Leading vs. Lagging Metrics: Sort by Leading Indicators (e.g., Created Activities, Win Rate) to predict future performance or Lagging Indicators (e.g., RevenueRevenue Revenue is the amount of money a business generates during a specific period such as a year or a quarter; also called sales. Won, Opportunities Lost) to review past results.
- Comprehensive KPIs: Access critical metrics like Sales Velocity (total expected revenue per day) and Average time spent in the cycle.
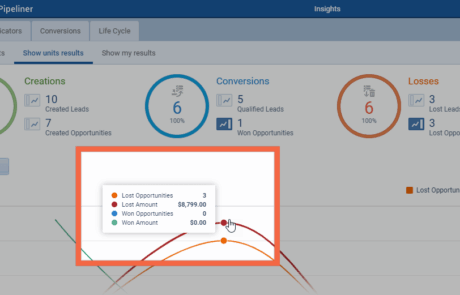
- Drill-Down to Action: Click any point on a graph or chart to instantly view and take action on the underlying list of records (export, run an Automatizer process, or send a mass email).
The Conversions Tab: Map the Journey
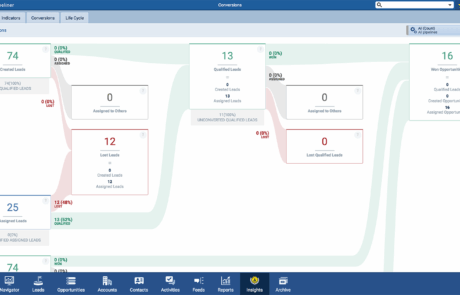
Follow the entire flow of your sales process to identify drop-off points and success paths.
- Lead-to-Opportunity Flow: See how many Leads successfully qualify and how many are lost.
- Visualize Success & Failure: Green areas highlight Won flows, while red regions visualize Lost paths, making immediate process auditing simple.
- Count or Value: Analyze conversions by the number of records or by their total monetary value.
The Performance Tab: Optimize Your Pipeline
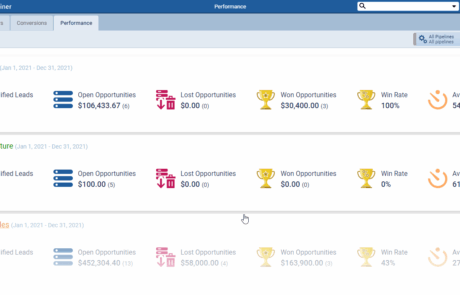
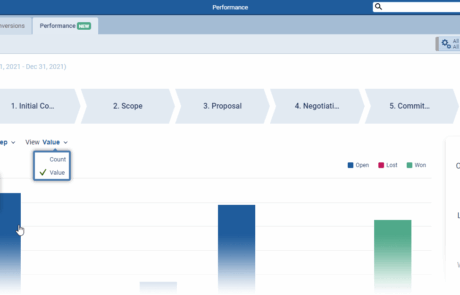
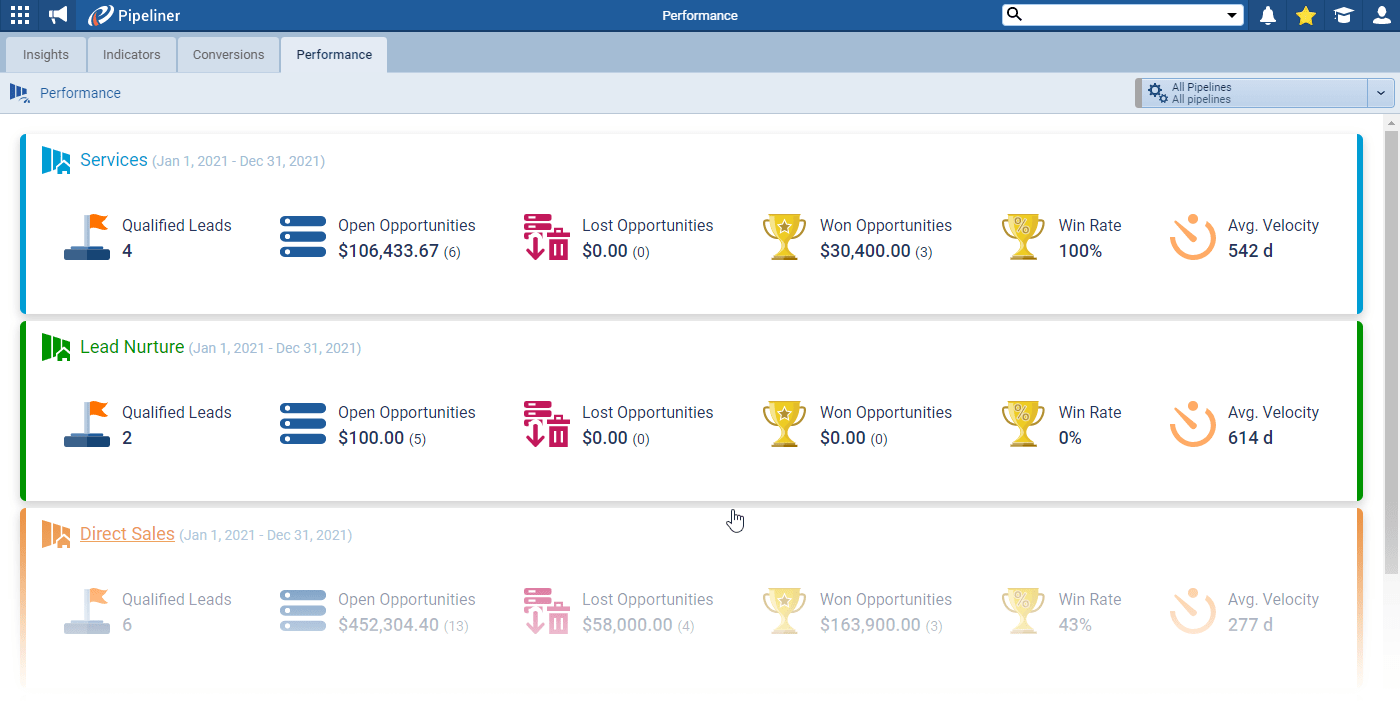
This tab provides your pipeline’s health report, offering in-depth, intuitive feedback at every step of your process.
- Pipeline Health Overview: Instantly view Win Rate, Total Value of Open/Lost/Won Opportunities, and Average Velocity for each pipeline.
- Step-by-Step Analysis: Drill down into a specific pipeline to analyze Velocity, Conversion Rates, and Win Probability at the step or user level.
- Proactive Adjustments: Armed with the average time spent in each step, you can proactively address hurdles that delay closure and move deals faster.
Take Control with Custom Filters & Views
Pipeliner CRM Insights is designed for ultimate flexibility and actionable intelligence.
Power Panel: Precision Filtering
- Date & Frequency: Define custom date ranges (month, quarterQuarter Quarter is a three-month period in a company’s fiscal year commonly used to make comparative performance analyses, detect or forecast business trends, report earnings, and pay shareholder dividends., year) and use the Actual Close Date for ironclad accuracy.
- Custom Filtering: Go beyond the basics! Use the Filter tab to view metrics for a specific Lead Source, Industry, AccountAccount Account refers to a record of primary and background information about an individual or corporate customer, including contact data, preferred services, and transactions with your company., or Contact field—just like you would elsewhere in Pipeliner CRM.
Save & Share Your View
- Custom Profiles: Save your unique combination of filters and KPIs as a Custom Profile for instant access next time.
- Team Collaboration: Share your meticulously crafted reports with specific users or teams to ensure everyone is operating from the same data-driven perspective.

„Focus allows an organizationOrganization Organization is a cohesive group of people working together and formally bound by a shared identity (e.g., one team, company, club, etc.) and a common purpose (e.g., business growth, athletic victory, etc.). to learn and become more efficient; efficiency increases productivity, and productivity leads to profitabilityProfitability Profitability is the potential, degree, metric, ability or relative efficiency of a business to yield financial gain (i.e., profits) after all relevant expenses and costs have been deducted. without the constant need for human error.“
Nikolaus Kimla • Founder & CEO • Pipeliner CRM
Frequently Asked Questions (FAQ) about Sales Insights
The primary purpose of CRM Insights (or CRM AnalyticsAnalytics Analytics is the active study of different types of data with the aim of discovering meaningful patterns and translating these into insight (such as historical analyses and forecasts), or action (such as those intended to improve business performance).) is to transform raw sales data into actionable business intelligence< Instead of simply recording activities, it visualizes Key Performance Indicators (KPIs) and trends related to your Leads, Opportunities, and Activities. This enables managers and representatives to make data-driven decisions on where to focus their time, which process steps to address, and how to enhance sales performance.
This is a core concept in data-driven sales management:
- Leading Indicators (such as created activities or Sales Velocity) help you predict future outcomes. These are inputs you can influence now.
- Lagging Indicators (such as revenue won or Opportunities Lost) reflect past results. These confirm whether your past strategies were successful.
Pipeliner’s Indicators Tab enables managers to track both sides simultaneously, providing a comprehensive view for both forecastingForecasting Forecasting is a prediction or calculation of a trend or event likely to occur in the future based on qualitative, quantitative and historical data as well as emergent but relevant factors. and coaching.
Pipeliner’s Performance Tab is designed explicitly for bottleneck analysis. It provides two key metrics:
- Average Velocity by Step: This shows the average number of days deals spend in each stage of your pipeline.
- Conversion Rate by Step: This highlights the proportion of Opportunities successfully moving from one step to the next.
By reviewing these, you can instantly see which step is slowing down your deals or causing the most drop-offs, allowing you to address specific process or coaching issues.
Yes, the data is highly reliable because Pipeliner Insights relies on system-level, unchangeable metrics for accuracy:
- Date Metric: Insights uses the “Actual Close Date” (the date an Opportunity was physically moved into the Won or Lost column), ensuring accuracy, as opposed to the changeable “Close Date.”
- User Metric: Insights are based on the user who acted (e.g., the rep who moved the Opportunity to Won/Lost), not just the current Opportunity Owner (which may have changed). This provides accurate credit for performance.
Absolutely. The Power Panel in Insights allows for robust customization. You can:
- Use the Filter tab to apply criteria based on any field.
- Save this unique combination of criteria, KPIs, and date range as a Custom Profile View.
- Share your Custom Profile with other managers or team members, ensuring everyone is analyzing performance based on the same parameters.
Insights offer objective, data-driven coaching tools:
- Benchmarking: The Indicators Tab lets you compare all reps against the same KPIs and benchmarks.
- Drill-Down: You can click on any specific data point (e.g., a low conversion rate for a rep) to instantly drill down to the underlying list of Leads or Opportunities. This allows you to move directly from a high-level trend to the specific records that require attention.
- Focus on Inputs: By focusing coaching efforts on Leading Indicators (like Activity Volume) from the Indicators Tab, managers can influence future performance rather than just reacting to past failures.
Learn More About Pipeliner CRM
Take a no-obligation 14 day trial of Pipeliner CRM.
No credit card info required – just experience for yourself how it could impact your sales.

