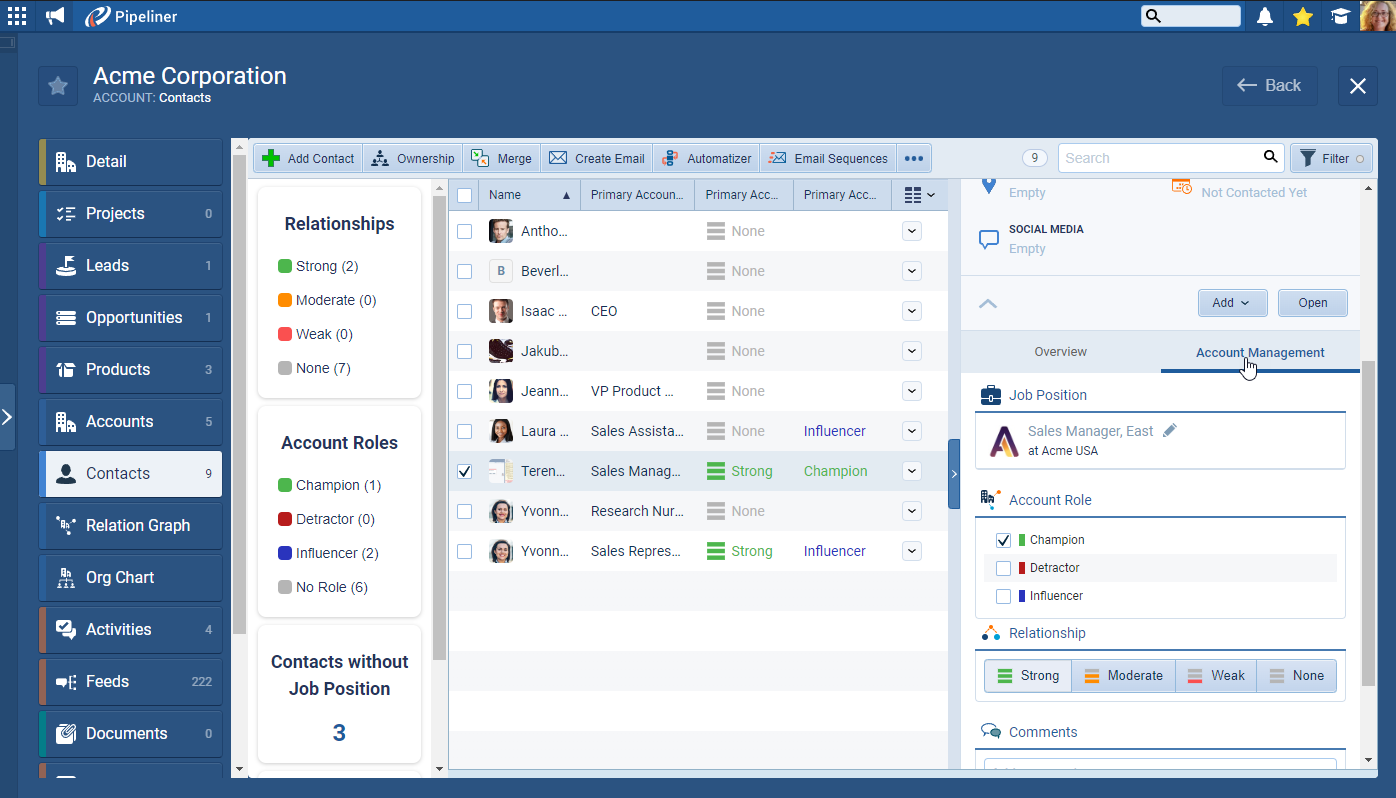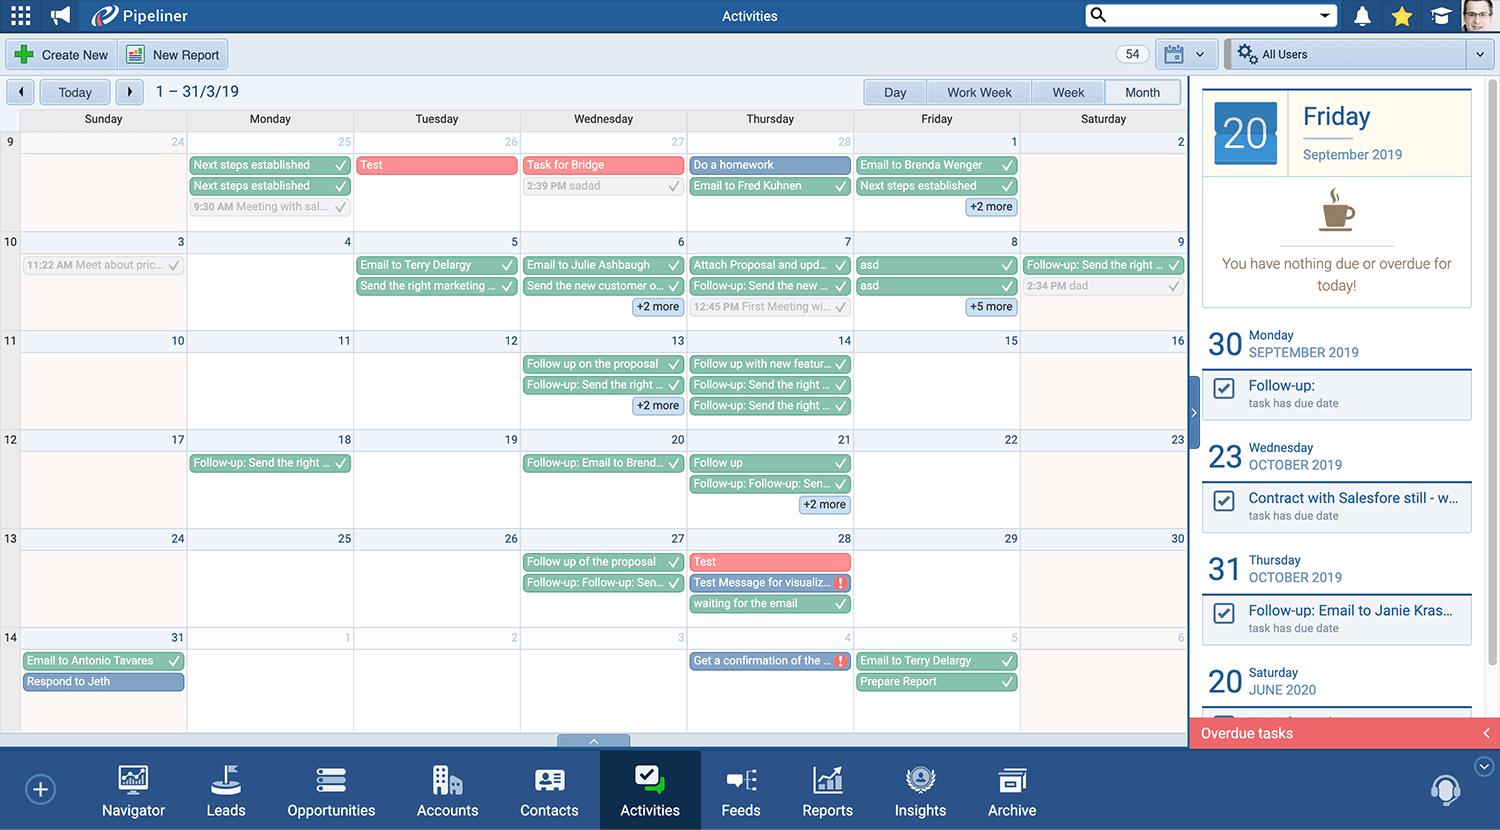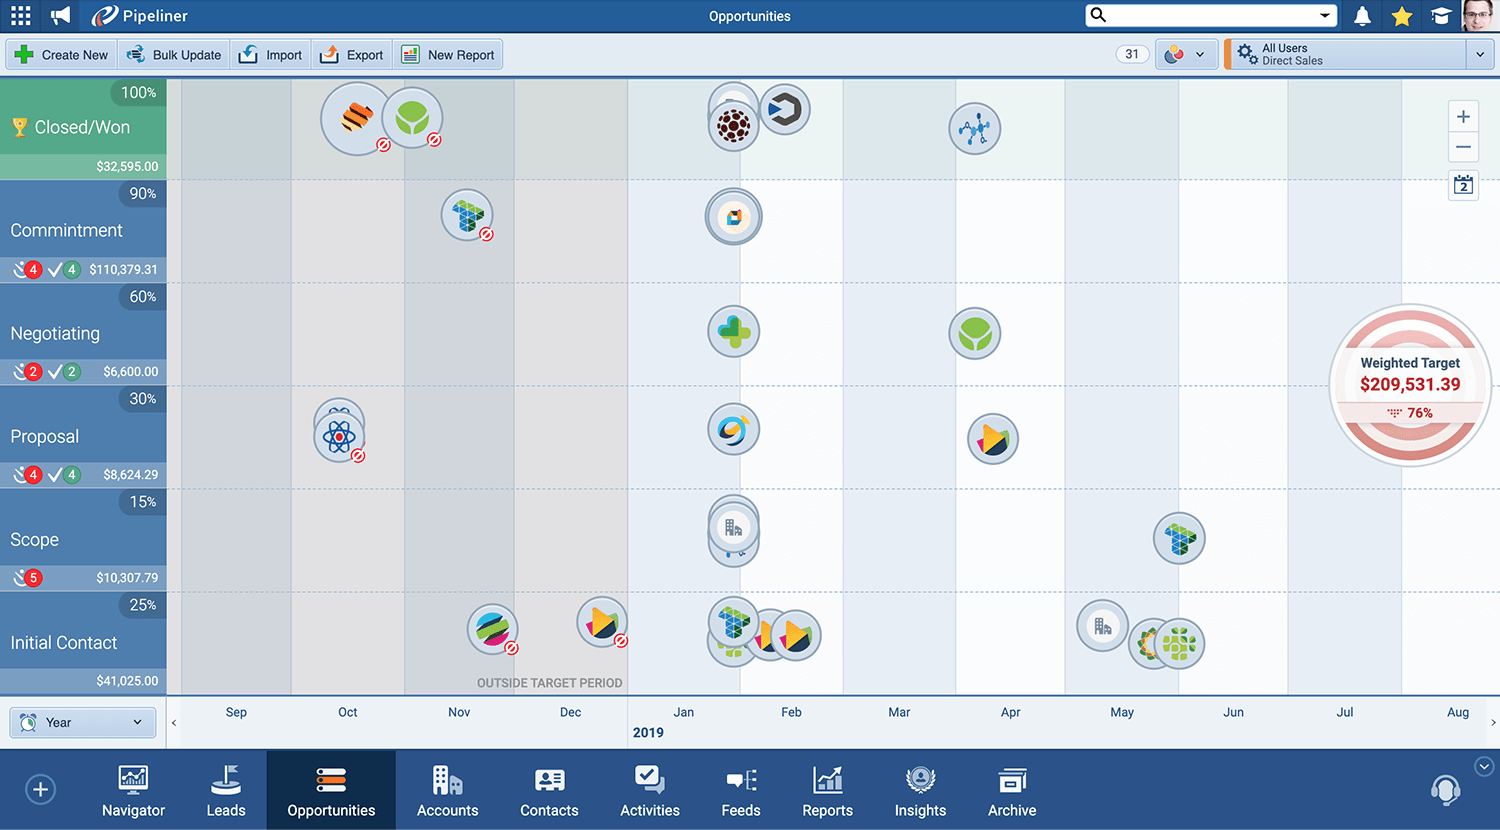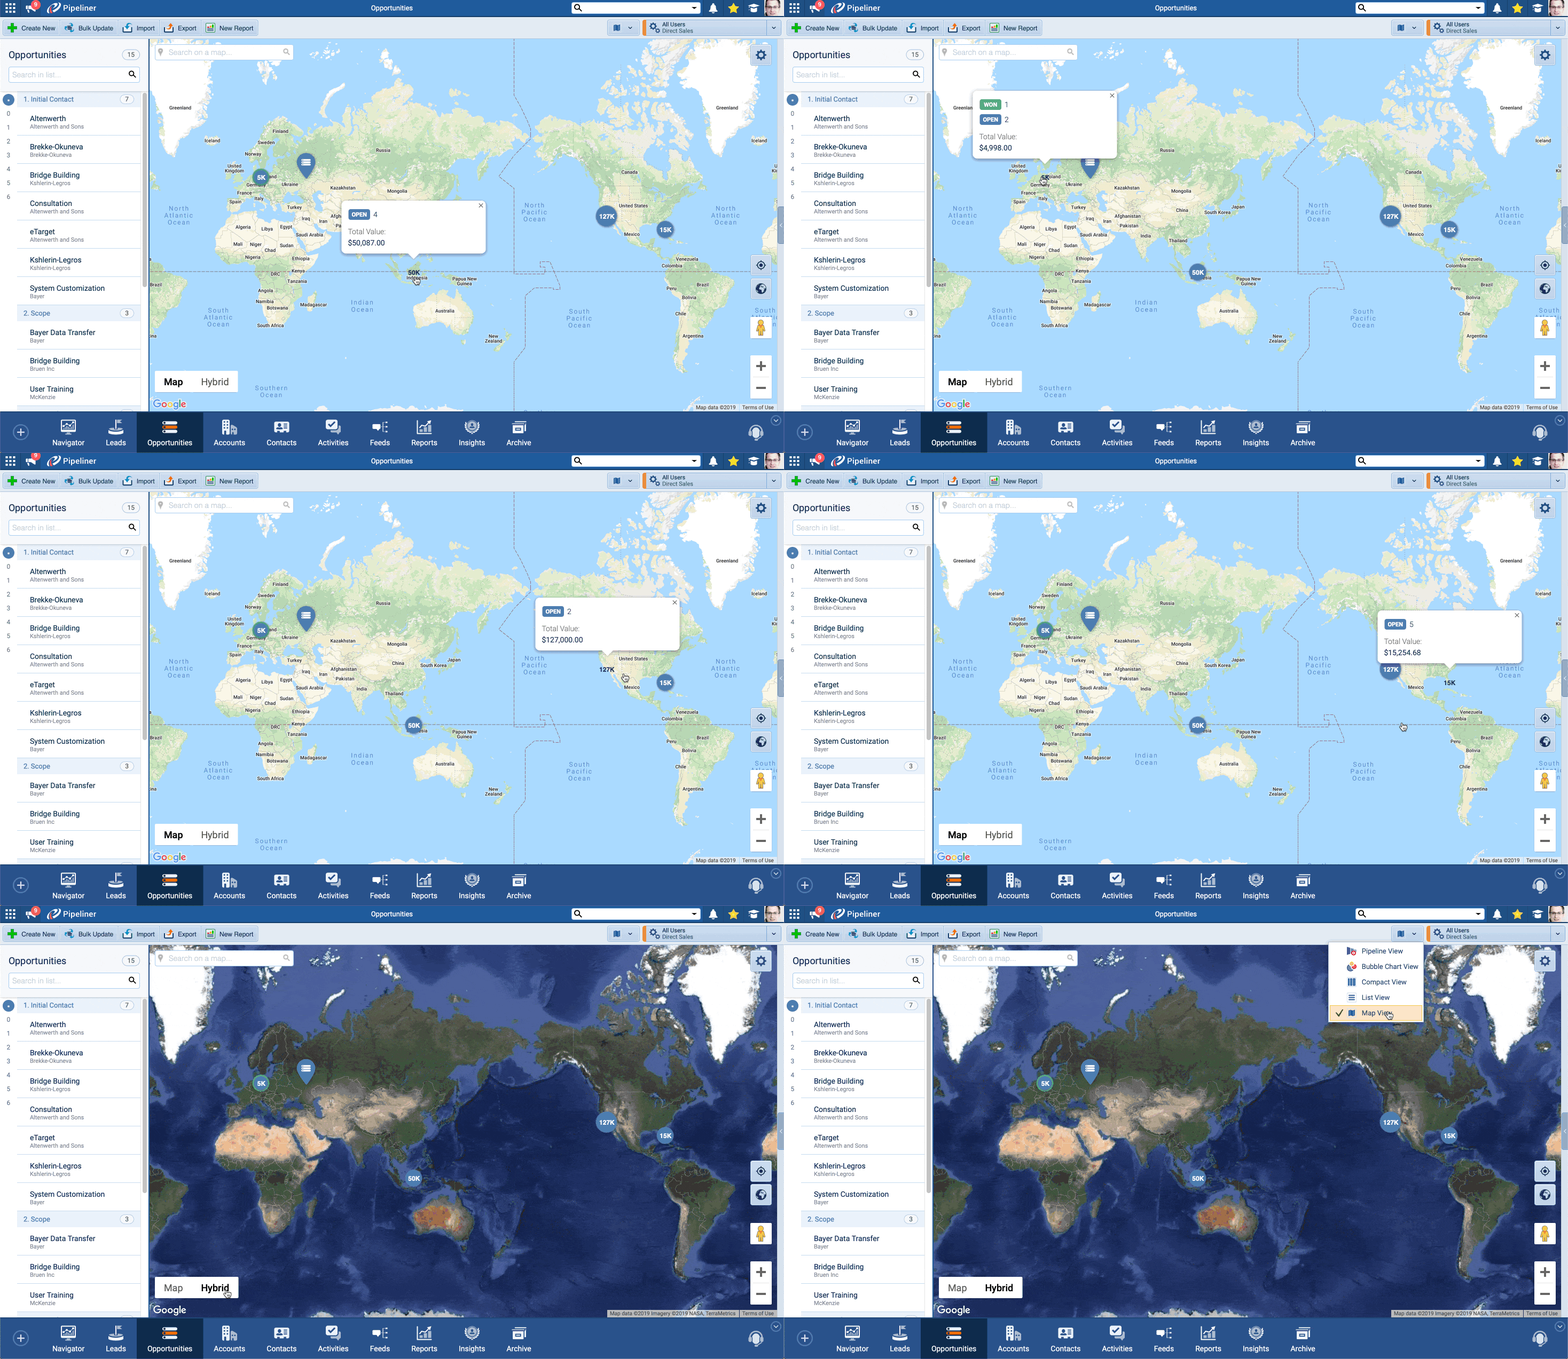
Stop guessing and start leading. Pipeliner CRM’s Visual AnalyticsAnalytics Analytics is the active study of different types of data with the aim of discovering meaningful patterns and translating these into insight (such as historical analyses and forecasts), or action (such as those intended to improve business performance). and Dynamic Dashboards feature transforms your raw CRM dataData Data is a set of quantitative and qualitative facts that can be used as reference or inputs for computations, analyses, descriptions, predictions, reasoning and planning. into crystal-clear, actionable insights, giving you complete control over your sales performance. Move beyond static reports—build a living, breathing view of your business that tells you exactly where to focus your energy for maximum impact.
Instant Intelligence, Actionable Results
The gap between seeing the data and taking action has been eliminated. With Pipeliner CRM, your insights are instant and actionable.
- Close the loop faster: Drill down from any chart element directly into the underlying, editable CRM records. See a dip in a performance metric on your chart? Click once to instantly update the records without navigating away. It’s data-to-action in seconds.
- Dynamic, Real-Time Reporting: Reports and charts auto-update the moment data changes in Pipeliner CRM. You’re always making decisions based on the absolute truth, eliminating the risk of acting on outdated information.
Your Competitive Edge: Personalized Performance Views
No more rigid, one-size-fits-all reporting. Pipeliner CRM enables you to create a personalized command center tailored to your role and goals.
- Personalized Dashboards: Easily create and customize unlimited Dashboards with a mix of chart types, including Scorecard, Pie, Line, Bar, and Column charts. Every userUser User means a person who uses or consumes a product or a service, usually a digital device or an online service. can build their perfect view, from individual activity tracking to high-level executive summaries.
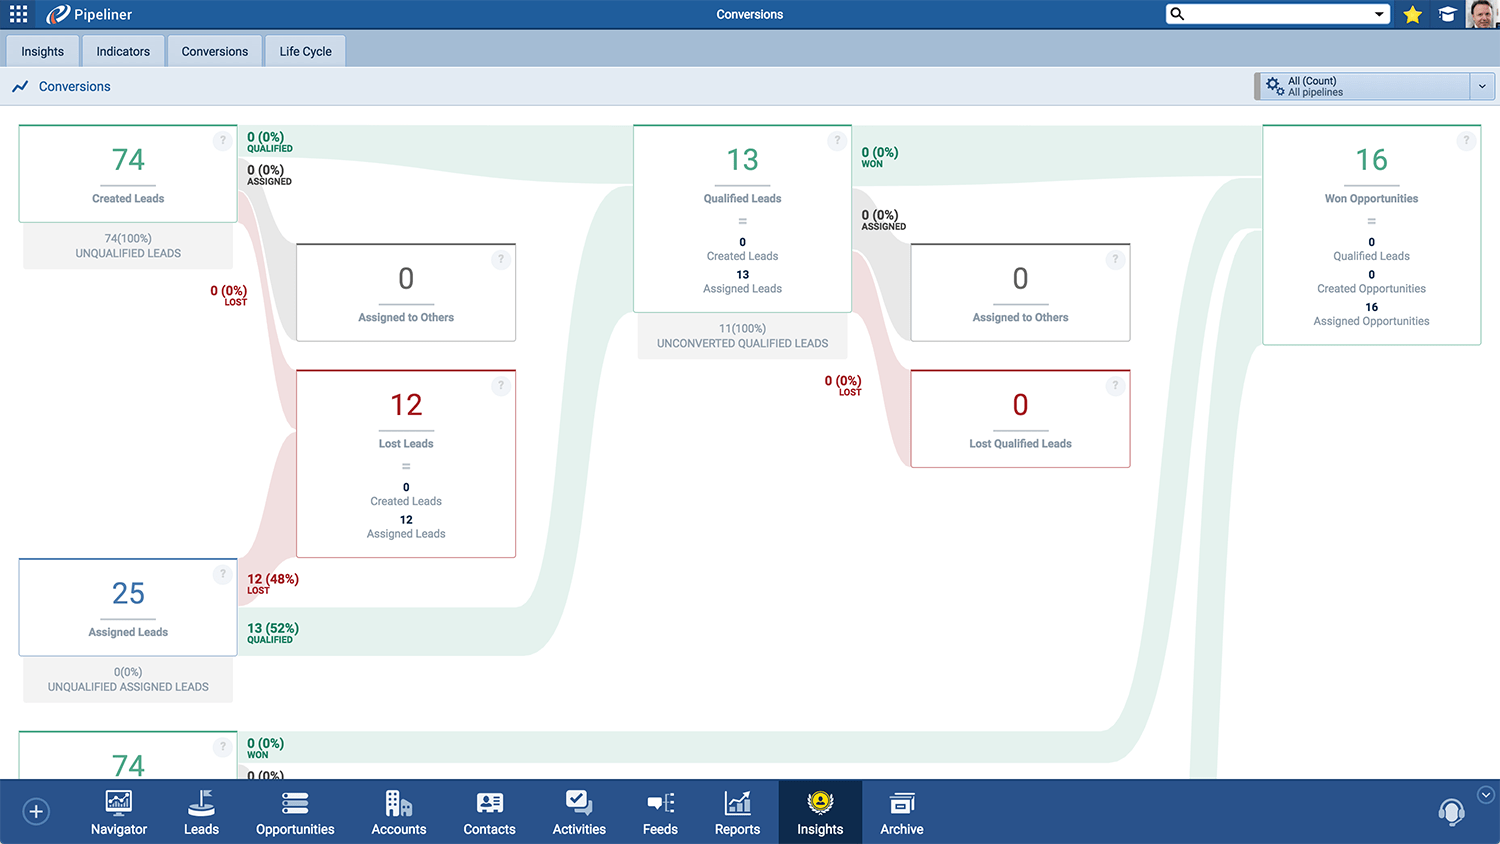
- Visualize Trends and Velocity: Use advanced features such as Running Totals to track cumulative sales over time and Period Comparisons (e.g., “Previous Period” or “To Current Date”) to identify opportunities and threats. See how your conversionConversion Conversion is the process of turning a target consumer into a paying customer; or more generally, the point at which a user performs a specific action favorable to a marketer or a seller. rates change step by step across your pipelinePipeline Sales pipelineis a visual representation of the stage prospects are in the sales process..
- Optimize Your View: Craft the perfect visualization by choosing from a rich library of chart types and leveraging Advanced Data SegmentationSegmentation Segmentation is the process of subdividing a large market into distinct partitions (or segments) based on demographics and other factors, with the aim of formulating and implementing separate strategies to better engage the consumers in each segment.. Use Grouping and Segmenting to break down complex metricsMetrics Metrics are quantities that are measured and used to:, like visualizing total opportunity value segmented by multiple owners or productProduct Product refers to anything (an idea, item, service, process or information) that meets a need or a desire and is offered to a market, usually but not always at a price. lines.

Simplify Collaboration and Communication
Data is only powerful if it’s shared and understood. Pipeliner CRM makes collaboration effortless.
- Seamless Sharing: Effortlessly share Dashboards with individuals, teams (Sales Units), or make them public, with flexible editing and read-only permissions. Ensure everyone—from the CEO to the newest sales rep—is looking at the same trusted data.
- Effortless Export: Easily extract data from the system and integrate it into stakeholderStakeholder Stakeholder is an entity with an interest in a company, process, or product, and which is typically concerned about its wellbeing. meetings, proposals, and internal emails instantly. Export reports to Excel/CSV, print Dashboards to PDF, or copy charts as images for quick inclusion in presentations.
Built for Efficiency: The Power of Dashboard-Level Control
The best part of Pipeliner CRM’s Analytics isn’t just seeing the data—it’s managing the reports themselves with minimal effort.
Time-Saving Feature Spotlight: Dashboard-Level Filtering
Create one comprehensive Dashboard (e.g., “Team Opportunity Overview”) and apply a filter to the entire dashboard at once. There is no need to update the filter on 10 separate charts. Copy the dashboard, use a filter for a different team or user, and you’ve created a new, ready-to-share report in seconds. Efficiency amplified.
- Templates and Profiles: Create new reports instantly from existing saved Profiles, ensuring consistency and saving you crucial setup time.
- Deep Filtering: Apply advanced, custom filters based on any Pipeliner CRM field (e.g., Opportunity Created Date is in the Current Year) to ensure your report shows only the most relevant, targeted data.
Ready to stop guessing and start leading with real-time, actionable sales intelligence?
Frequently Asked Questions (FAQ)
Our Visual Analytics transforms raw CRM data into instant, actionable intelligence. Instead of waiting for weekly reports, your team sees progress, trends, and bottlenecks in real-time via dynamic charts and dashboards. The moment a deal stalls or a goal is hit, the visual data reflects it. Plus, you can click on any chart element to drill down instantly to the underlying records and take immediate action, eliminating lag time between insight and execution.
Absolutely. Pipeliner CRM allows you to create unlimited, fully customizable Dashboards. You can mix and match chart types (Scorecard, Line, Column, Pie) and use advanced filtering to create unique, personalized command centers. A sales rep can focus on their daily activity and pipeline velocity. At the same time, an executive can view high-level revenueRevenue Revenue is the amount of money a business generates during a specific period such as a year or a quarter; also called sales. forecastingForecasting Forecasting is a prediction or calculation of a trend or event likely to occur in the future based on qualitative, quantitative and historical data as well as emergent but relevant factors. and team performance, all from a shared, consistent data source.
The Running Total feature provides a cumulative sum or count of a measure over a specified period. This is crucial for accurate sales forecasting and trend analysis. It allows you to easily track and visualize the total sales accumulated over time (e.g., year-to-date revenue) and instantly compare that pace against previous periods, helping you spot trends and ensure you’re on track to hit annual targets.
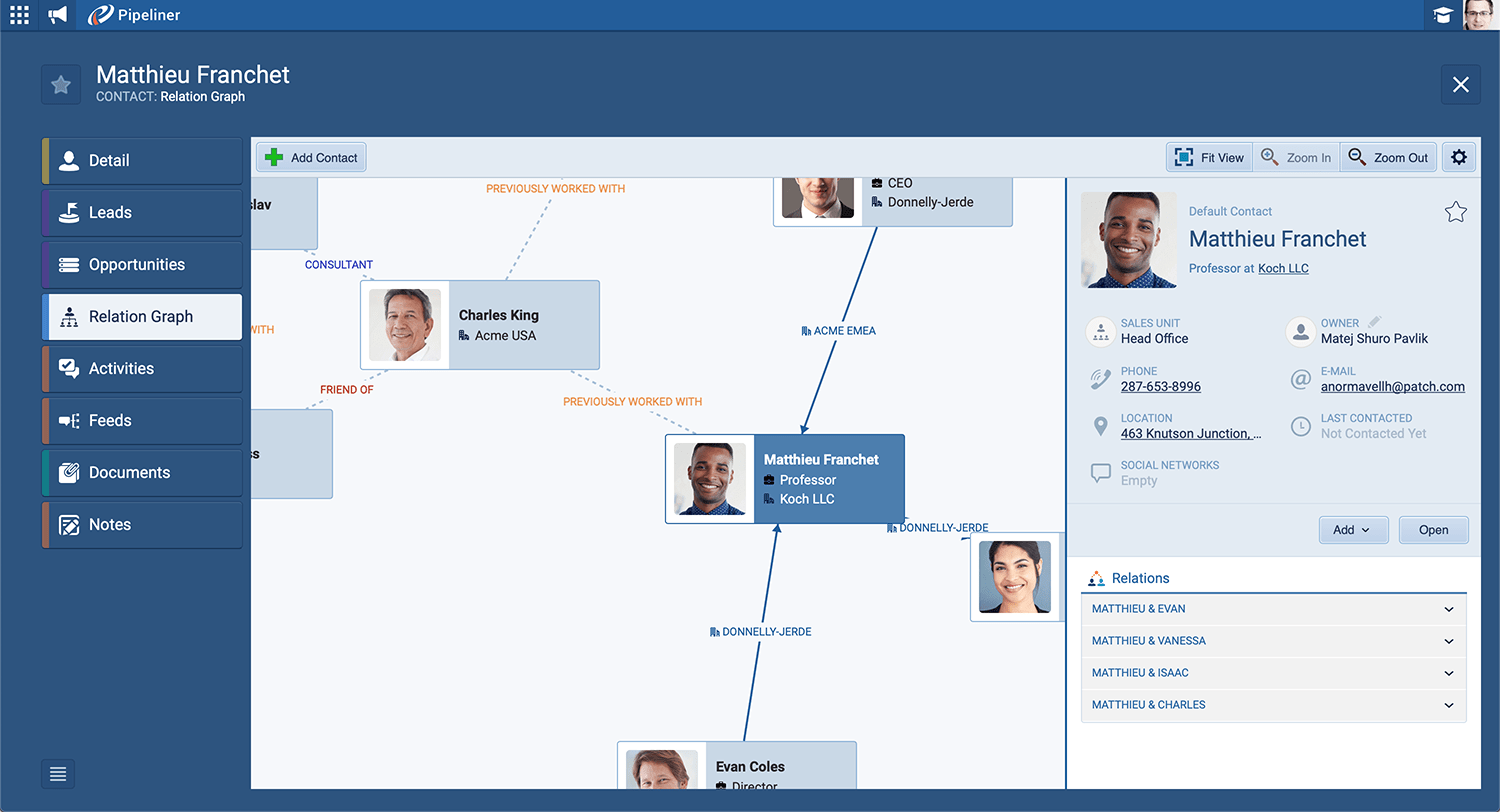
The Buying Center is a powerful visual relationship mapping tool for complex B2BB2B B2B is an acronym for Business-to-Business, a model for selling, relationship-building, or engagement. deals. It lets you map out all the individuals involved in a buying decision—not just the primary contact—and assign them specific roles (e.g., Decision MakerDecision Maker Decision Maker in the context of sales, is a person who possesses the required expertise and authority in making purchase decisions., Influencer, Budget Holder, Blocker). By visually understanding who influences the deal and how they connect, your team can tailor its strategy, avoid internal roadblocks, and focus engagementEngagement Engagement is the state or process of keeping a specific class of audience (employees, management, customers, etc.) interested about a company or brand and invested in its success because of its perceived relevance and benefits to the audience. on the right people, leading to higher win rates and shorter sales cycles.
Pipeliner CRM provides a clear visual distinction and seamless transition management. You can define distinct LeadLead Lead refers to a prospect or potential customer (who can be an individual or organization) that exhibits interest in your service or product; or any additional information about such entity. Processes with unique qualification gates and scoring criteria. Once a Lead meets your standards (i.e., is qualified), you convert it into an Opportunity within a defined sales pipelineSales Pipeline Sales Pipeline is a type of visualization showing the status of each sales prospect in the customer life cycle or sales process.. This visual process ensures only high-quality leads enter your valuable pipeline, allowing reps to focus their time on the prospects most likely to close.
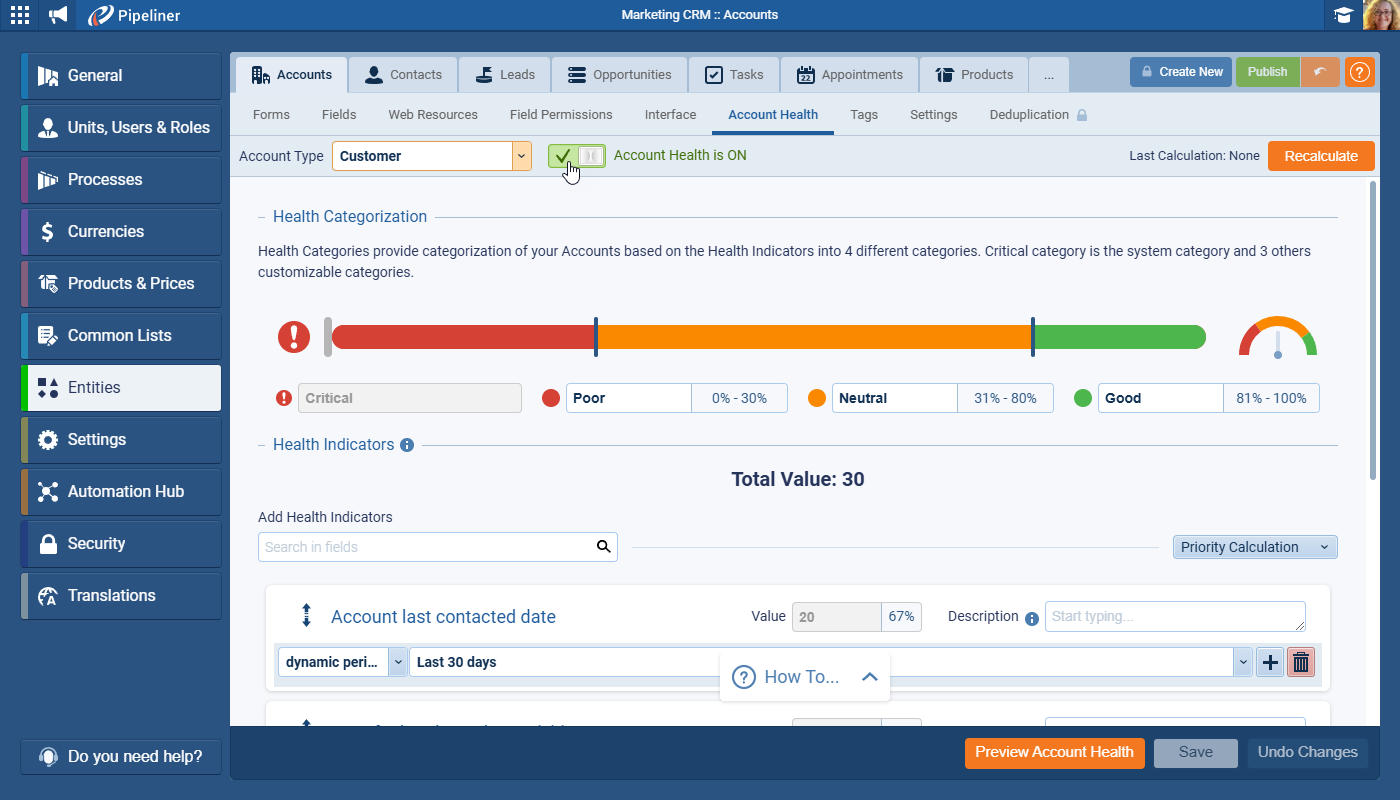
Yes. The visual pipeline includes features like Opportunity Fitness indicators that provide an instant, at-a-glance health check. These visual cues flag potential risks—such as overdue follow-ups or deals that have stalled in a stage for too long—before they can derail your progress, allowing managers to intervene proactively and coach reps effectively.
Learn More About Pipeliner CRM
Take a no-obligation 14 day trial of Pipeliner CRM.
No credit card info required – just experience for yourself how it could impact your sales.

